CHAPTER 1 - ASIA-PACIFIC ECONOMIC OUTLOOK
CONTRIBUTED BY MR EDUARDO PEDROSA, SECRETARY GENERAL, PECC INTERNATIONAL SECRETARIAT AND COORDINATOR OF THE STATE OF THE REGION REPORT PROJECT
The mood across the Asia-Pacific has soured since this time last year with expectations for global growth turning distinctly negative. Regional economic growth is expected to slow from 3.8 percent growth in 2018 to 3.3 percent growth this year. However, it is the dramatic slowdown in the external sector that is of most concern with export growth slowing from 4.0 percent to just 0.9 growth this year for Asia-Pacific economies. While governments are acting to moderate a slowdown through stimulus measures, primarily interest rate cuts, other actions also need to be taken.
The first among these is to restore confidence in the rules-based trading system. Of immediate concern is the resolution of the USChina trade conflict, which is having a broad and costly impact on business decisions. The second is to undertake significant unilateral structural reform measures to promote more balanced, inclusive, and sustainable growth. The corporate sector across the region and the world has large amounts of cash reserves that can be invested into long-term growth and productivity enhancing activities, however, policy uncertainties have kept capital expenditure at persistently low levels. Third while many of the actions required to combat a slowdown lie with domestic authorities, trust must be restored to enable sufficient coordination if not cooperation among competent authorities on the wide range of challenges.
As demonstrated by the swift conclusion to the U.S.-Japan Trade Agreement, this is not beyond the realm of possibility.
This is a year of anniversaries, it is the 75th anniversary of the creation of the Bretton Woods Institutions – the International Monetary Fund and the World Bank, the 30th anniversary of the creation of APEC, the 20th of the G20 process, and the 10th since G20 leaders agreed to a Framework for Strong, Sustainable and Balanced Growth that APEC leaders agreed to support in the same year and “to develop a comprehensive long-term growth strategy that supports more balanced growth within and across economies, achieves greater inclusiveness in our societies, sustains our environment, and which seeks to raise our growth potential through innovation and a knowledge-based economy.”
As shown in Figure 1.1, only 9 percent of respondents to PECC’s annual survey of the Asia-Pacific policy community expect the global economy to strengthen next year with 68 percent expecting somewhat or much weaker growth. Effectively this is a materialization of risks presaged last year when concerns were rising over the impact of protectionism. There are ongoing debates on whether the relatively strong growth in terms of both trade and aggregate demand over the past 12 months have been a result of the surprisingly small impact of the trade war or ‘front-loading’ on the part of the business sector – stocking up before higher tariffs come into effect.
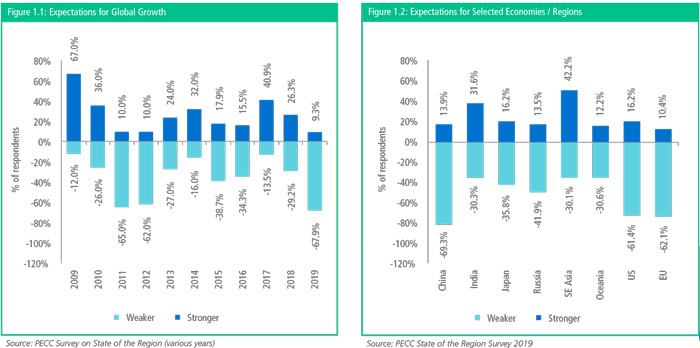
Next year APEC economies will reach the deadline of 2020 for the Bogor Goals of achieving ‘free and open trade in the Asia- Pacific’. Amidst the somewhat gloomy outlook, the regional policy community had a rather more positive view towards growth in Southeast Asia, with 42 percent of respondents expecting stronger growth for the region next year. This reflects an expectation that at least some Southeast Asian economies will benefit from trade diversion as a result of the ongoing trade dispute between the US and China as well as continued strong domestic demand growth.
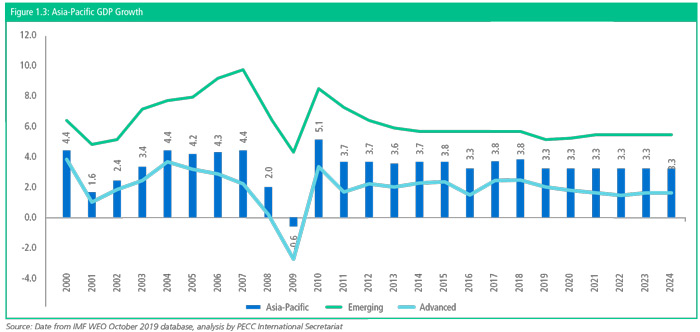
The Asia-Pacific region is expected to grow at 3.3 percent this year and perform at a similar rate over the coming years, based on the IMF’s latest data release. The region’s emerging economies are expected to grow by 5.2 percent this year, a marked deceleration from the 5.7 growth in 2017 before posting slightly improved growth of 5.3 percent in 2020. While the region’s advanced economies are expected to grow by 2.0 percent in 2019 and continue that deceleration into 2020.
At this point last year, the forecast for Asia-Pacific growth in 2019 had been 3.7 percent, the downward revision of 0.4 percentage points comes as a result of the worsening of the trade conflict between the United States and China and the uncertainty that this brings to the business community. In response to this souring outlook, governments around the world are lowering interest rates. For example, on 22 July the US Federal Reserve announced that it would cut interest rates by 0.25 percentage points and once again by the same amount on 18 September. In August alone, central banks in India, New Zealand, Thailand, and the Philippines cut rates. Many of these were the first rate cuts since the emergency response to the Great Recession. Outside of the region, on 12 September, the European Central Bank announced that the interest rate on the deposit facility will be decreased by 10 basis points to -0.50% and that it will restart its quantitative easing program from 1 November.
An additional factor is the impact of higher energy prices on regional economies due to instability in the Middle East, as demonstrated by the spike in oil prices following the attack on Saudi Arabia’s oil producing infrastructure. The attack removed about half of Saudi Arabia’s productive capacity and caused a spike in global oil prices. The longer-term concern is if the capacity cannot be restored or compensated for quickly and if the region becomes more unstable, oil prices could reach US$100 a barrel.
How bad is it?
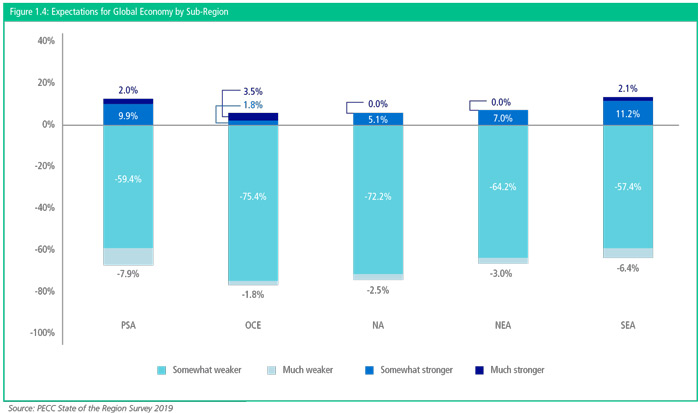
As seen in Figure 1.4, while expectations for global economic growth over the next year are negative, they tend towards ‘somewhat weaker’ growth. Overall, 60 percent of respondents expected growth for the global economy to be ‘somewhat weaker’ while 8 percent expected it be much weaker. The magnitude of that expected slowdown is difficult to gauge. According to the IMF’s latest forecasts, the global economy grew by around 3.6 percent in 2018 and is expected to grow by 3.0 percent this year. Expectations are clearly that this negative trend will continue. There are several risk factors that support this negative prognosis. The trade conflict has already been mentioned, the risks as perceived by the Asia-Pacific policy community will be discussed below. Other recent factors include political risks in the Middle East and the
In summary, while the headline forecast for economic growth is far from a global recession, the policy community is expecting a slowdown and central banks are taking measures to forestall the worst outcomes. According to the IMF, without those stimulus measures, global growth would be 0.5 percentage points lower in 2019 and 2020.
Risks to Growth
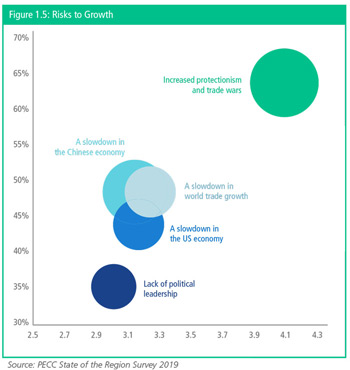
The top five risks to growth identified by our survey of the Asia- Pacific policy community for their economies over the next 2-3 years were:
- Increased protectionism and trade wars
- Slowdown in world trade growth
- A slowdown in the Chinese economy
- A slowdown in the US economy
- Lack of political leadership
Figure 1.5 shows three dimensions – the percentage of respondents who chose these issues as risks (vertical axis); the seriousness that those who selected it as a risk (horizontal axis); and the overall weighted risk – taking into account both the frequency and magnitude of the risk (size of bubble). While most risks tend to cluster – protectionism stood out in terms of the frequency and impact that respondents thought it would have on the prospects for the growth of their economies.
The list of risks remains the same as in the 2018, with one exception, a slowdown in the US economy has entered the top 5 list. In last year’s survey, it was the 7th highest risk with 30 percent of respondents selecting it as a top risk, this year, 44 percent of respondents selected it as a top risk making it the 4th highest risk. The US economy has been going through its longest ever economic expansion overtaking the boom that lasted from 1991 to 2001 that ended with the bursting of the dot com bubble. The question is whether this business cycle is due for a correction.
A slowdown of China’s economy has featured as a risk for a number of years. There are several factors behind this: one is the deep connections between China and regional economies. There used to be a saying that when the US sneezes, the rest of the world a cold, due to the deep connections on regional value chains, it might now be said that when China sneezes, Asia catches a cold. A second key factor is that China’s growth has been going through a slowdown from the heady days of 10 percent a year growth to a “new normal” growth of around 6 to 6.5 percent a year.
However, related to the slowdown in the major economies is the potential for spillover or contagion risks from top two risks in this year’s survey - increased protectionism and trade wars and the slowdown in world trade growth – might have for world capital markets.
One metric that financial markets have been monitoring closely over the past 12 months has been the yield curve for fixed income instruments bonds. Simply put, in normal times, investors demand higher returns on longer term investments because of the risks involved with locking their funds up for that amount of time. Now investors have become so concerned over short terms risks that longer term investments have become ‘safer’ – so the yield curve have become inverted.
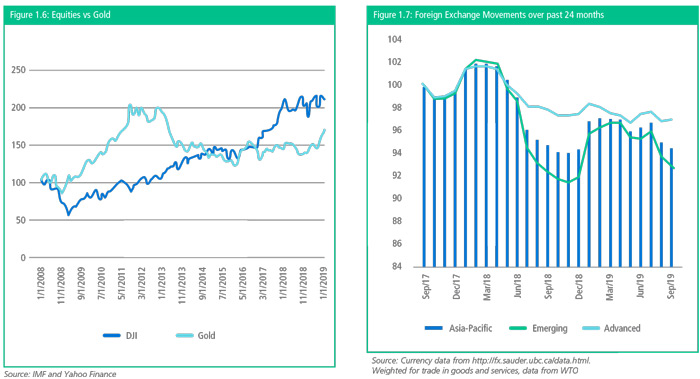
On October 9, 2007, the Dow Jones Industrial Average (DJI) hit its pre-recession high of 14,164 and by March 5, 2009, it had dropped more than 50% to a low 6,594.44. Figure 1.6 which indexes the price of gold and the DJI at the beginning of 2008, show the relative performance of gold and equity prices in the United States. Until October 2016, gold would have seemed a relatively good investment. However, since then the DJI has by far outpaced the performance of gold. But from mid-2019, the value of gold has jumped. In US$ terms this was an increase in the price of gold from US$1,413 per ounce to US$1,499. This is another signal of economic uncertainty.
As last year’s State of the Region report noted, regional currencies have been losing value against the US dollar. From August 2017 to August 2018, a composite of Asia-Pacific currencies weighted for trade had lost about 2.6 percent of value against the US dollar. As shown in Figure 1.7 by September this year, that devaluation had reached 5.5 percent over the 24-month period. Emerging economy currencies had lost more ground at 7.3 percent compared to the region’s advanced economies which lost 3.1 percent. The larger concern for the region, given the backdrop of deteriorating trade relations is that economies seek competitive trade advantage through a devalued currency. Such moves, however, might prove counter-productive. Regional economies are deeply connected through supply chains, and a devalued currency may improve export competitiveness it will also raise the cost of imports for producers.
In August this year, the US Treasury took the unprecedented move of designating China as a currency manipulator.3 This is something that the People’s Bank of China strenuously refutes, noting that the ‘RMB exchange rate regime is a managed floating regime based on market supply and demand and with reference to a basket of currencies.
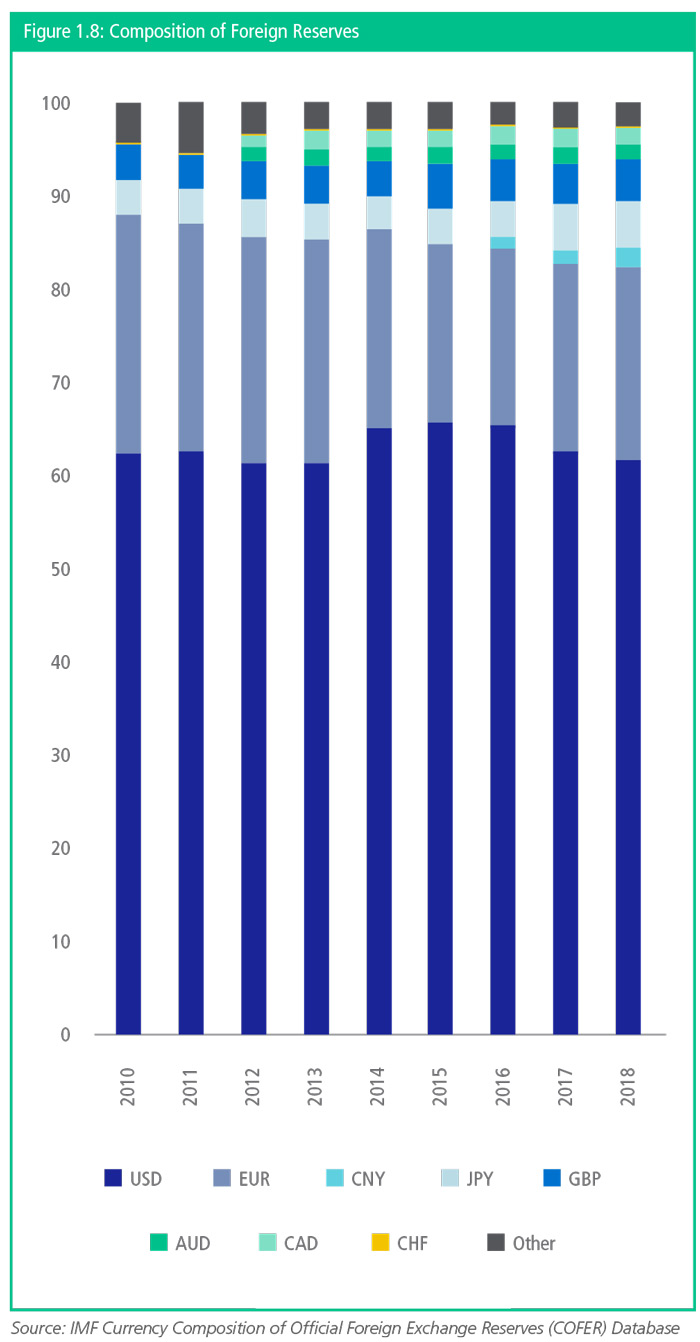
The relationship between the global monetary and the trade regime has come into focus in recent months. At a gathering of Central Bankers at Jackson Hole in the United States, the governor of the Bank of England suggested that as the world has moved into a multipolar system, the reliance on the US dollar as the reserve currency also needed to change.5 As shown in Figure 1.8, the US dollar accounts for approximately 62 percent of global reserves but approximately 10 percent of global trade and 15 percent of total output.
As an indication of the evolution of the monetary system, Figure 1.8 shows data from the IMF’s Currency Composition of Official Foreign Exchange Reserves (COFER) Database. This database covers 149 members of the IMF who voluntarily disclose the composition of their foreign exchange reserves. The list is by no means comprehensive with only US. dollar, Euro, Yen, Pound Sterling, Swiss Franc, Australian Dollar, and Canadian dollars and Chinese RMB included. Since the RMB was included in this list, its share has risen from 1.1 percent of reserves to close to 2 percent. These allocations are by no means static, for example in the early 1990s considerably more reserves were held in Japanese Yen. Even US dollar reserve holdings have fluctuated over time, peaking at 71 percent at the turn of the millennium.
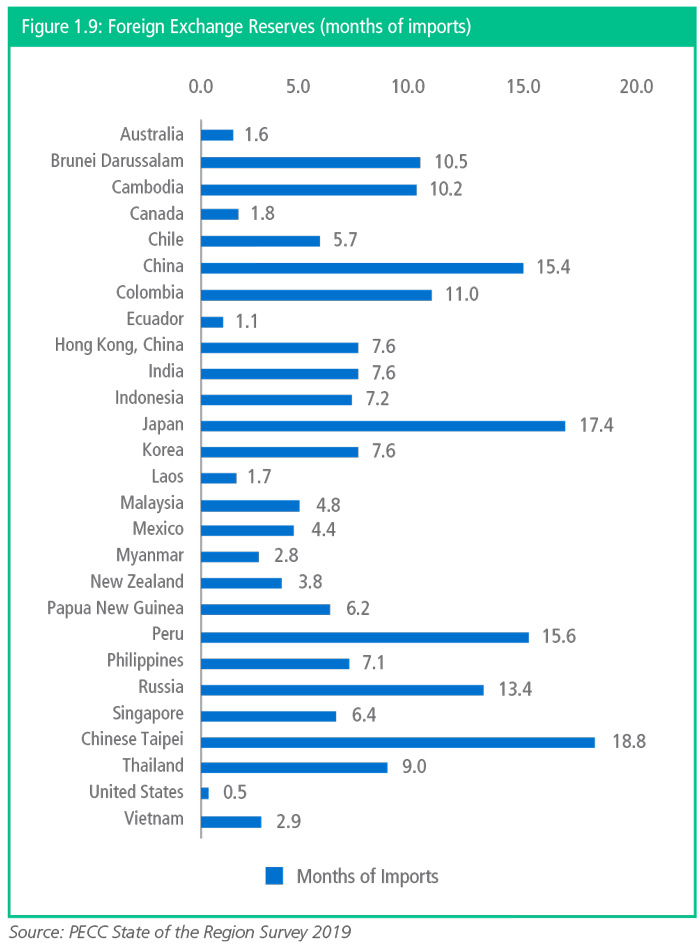
Such a transition would be extraordinarily complex. But it has happened before with the transition from the Sterling to the US dollar. The rationale that Mark Carney laid out was to alleviate the destructive cost on emerging economies of capital outflows and reduce the need to hoard large amounts of US dollar reserves. As shown in Figure 1.9, regional economies, especially Asian ones, tend to hold large amounts of reserves, well beyond the traditional 3 months of imports that used to be suggested as a benchmark. However, the IMF warns that traditional measures of reserve adequacy have limited relevance, ‘the reserve losses that many economies experienced during crises did not show any relationship with needs. This reflects the fact that each crisis is unique and that the impact of crises vary greatly, resulting from withdrawal of foreign capital, while others involve the loss of export income, or capital flight by domestic residents.
Impact of Rising Protectionism
As discussed earlier the top risk to growth in this year’s survey was increased protectionism and trade wars. As shown in Figure 1.10, concerns over the impact of protectionism on economic growth have been steadily rising over the past few years. In the years that immediately followed the Global Financial Crisis roughly a fifth of respondents cited rising protectionism as a risk for their economies, however, this dropped over time perhaps in response to the continued statements by global leaders that they would not adopt trade restricting measures. However, from 2015 onwards,these fears increased rapidly until rising protectionism became the top risk to growth in 2018 where it remained this year.
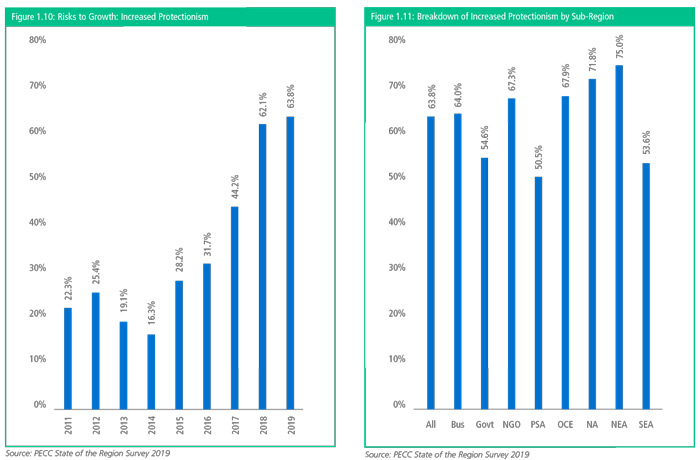
Figure 1.11 shows the breakdown of the results by sector as well as sub-region. Of concern is that 10 percent more business respondents selected increased protectionism as a risk to growth for their economies compared to government officials. While recognizing that increased protectionism and trade wars was still the top risk to growth for government officials surveyed, it is possible that they underestimate the magnitude the impact it is having on businesses – critical given that they are dealing with this issue in organizations such as the WTO, APEC, and bilaterally. It is therefore crucial that businesses and governments engage in constructive dialogues to understand both how the trade conflict is impacting business sectors as well as the magnitude of that impact.
Secondly, there are significant differences among respondents in different sub-regions on the risk to growth from protectionism. Again, while emphasizing that this was still the top risk to growth for both Pacific South America and Southeast Asia, around 50 percent of respondents from these sub-regions selected it as a top 5 risk to growth for their economies compared to 70 percent from other sub-regions.
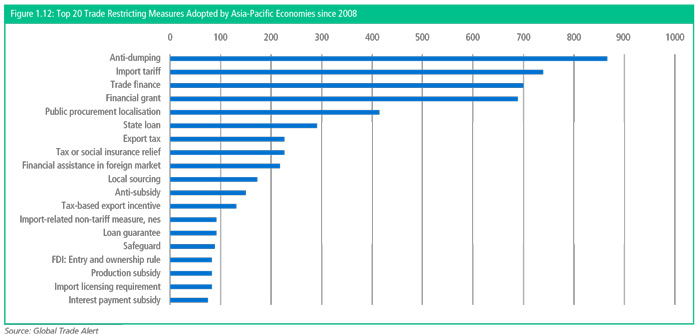
While much attention is given to the ongoing trade and technology “war,” as shown in Figure 1.12, in spite of well-intentioned pledges by G20 and APEC leaders, economies have been implementing a range of trade restricting measures since the Global Financial Crisis that used to be referred to as ‘creeping protectionism.’ Figure 1.12 shows the top 20 most frequently used trade restricting measures adopted by Asia-Pacific economies, according to data collected by the Global Trade Alert initiative.7 It is important to note here that this is not an official database. However, as G20 Leaders said in Pittsburgh in 2009, “We will keep markets open and free and reaffirm the commitments made in Washington and London: to refrain from raising barriers or imposing new barriers to investment or to trade in goods and services.” This language was very similar to that of APEC leaders in Singapore later that year: “We firmly reject all forms of protectionism and reaffirm our commitment to keep markets open and refrain from raising new barriers to investment or to trade in goods and services, and instruct our Ministers to continue to regularly review our adherence to these commitments.”
However, what constitutes a barrier to trade is always going to be a matter of perception and negotiation. Whichever data source is used, clearly the incidence of trade restricting measures is on the rise and these are having a material impact on trade flows in spite of well-intentioned and carefully crafted leaders’ statements. This separation of rhetoric and practice breeds cynicism and undermines the value of multilateral meetings and leaders’ declarations in the public mind.
Moreover, with what were thought as the rules being progressively circumvented, there is a rising element of uncertainty. For example, analysis undertaken by the Atlanta Federal Reserve estimates that the tariff hikes and trade policy tensions lowered gross investment in 2018 by 1.2 percent in the U.S. private sector and by 4.2 percent in the manufacturing sector or $32.5 billion $22 billion respectively. For 2019 the same work estimates that these numbers are rising, among firms reassessing expenditures, more than half have either postponed or dropped some portion of their capital spending for 2019.8 Another example comes from outside the region, since a referendum on 2016, United Kingdom has been negotiating the terms of its exit from the European Union. The original deadline has been postponed twice and may be again. It is estimated that this uncertainty has reduced business investment in the United Kingdom by 11 percent from 2016 to 2019.
The External Sector
As shown in Figure 1.13, export growth for Asia-Pacific economies is expected to slow significantly from 4.0 percent to just 0.9 percent before recovering to 3.0 percent in 2020. This drop is largely driven by negative export growth for the region’s advanced economies – especially those with deep value-chain connections: Japan; Korea; Chinese Taipei; and Singapore.
As per Figure 1.14, import growth is expected to slow even more sharply this year from 5.2 percent growth in 2018 to almost zero growth this year before recovering to 3.2 percent growth in 2020. Unlike on the export side, emerging economy imports are not expected to hold up this year. Some of this may be due to some lag effects along regional value chains.
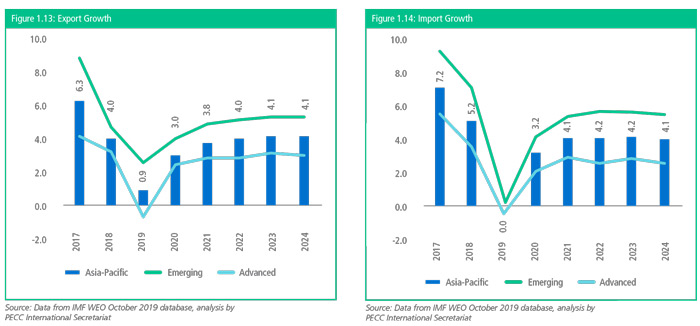
Clearly trade growth is a long way off from the heady rates of the 1990s and 2000s when it was growing at twice the rate of overall GDP. There is some expectation that trade growth will bounce back somewhat in 2020, this depends much on the overall environment for trade and whether there are spillovers of the trade conflict into other sectors of the economy. As mentioned earlier, PECC’s annual survey indicates some optimism for Southeast Asian economies. Vietnam exports are expected to continue to perform particularly strongly with growth at above 12 percent. Earlier forecasts had predicted other Southeast Asian economies on similar growth trajectories, however, while they are still performing well, there has been some moderation of expectations for the Philippines and Indonesia on the export side. (based on IMF forecasts, see Annex A for details).
Need for Forward Policy Momentum
At this time of uncertainty, regional economies may be pursuing as many different growth vehicles as they can. Some have made steps with agreements such as the Comprehensive and Progressive Partnership for Transpacific Partnership (CPTPP). The CPTPP entered into force at the end of last year and has proven a useful advantage for its members allowing them to attract investors looking to diversify or relocate supply chain production into parts of the region not affected by new tariffs.
If regional economies were able to come to agreement on the Regional Comprehensive Economic Partnership (RCEP) it would provide a significant boost to its members. As discussed below, the business community around the world has large reserves of cash but has been wary of investing. Reducing policy uncertainty through a long-term project such as the RCEP would be one way to attract those investments.
As mentioned above, the US and Japan came to a relatively quick agreement to a trade deal that addresses some of the trade diversion that the US farm sector suffered as a result of the US withdrawal from the TPP, while the Japan-EU FTA entered into force in February this year. These are systemically important deals covering large percentages of the global economy. As negative as the current outlook is, the configuration of the political economy does leave some hope that an interim deal could be struck between the US and China.
Lack of Political Leadership
Once again, the lack of political leadership was identified as a top 5 risk to growth. As harsh as the impact of the Global Financial Crisis was, the world narrowly escaped a much worse fate through a set of concerted actions, primarily coordinated through the G20. The Pittsburgh Declaration summarized the mood well “Global output was contracting at pace not seen since the 1930s. Trade was plummeting. Jobs were disappearing rapidly. Our people worried that the world was on the edge of a depression.” To prevent that from happening the international community came together and made “commitments to restore growth resulted in the largest and most coordinated fiscal and monetary stimulus ever undertaken.” At the same time G20 leaders also recognized the importance of an orderly exit from the stimulus stance and the need to “make decisive progress on structural reforms that foster private demand and strengthen long-run growth potential.”
This was further reinforced by APEC leaders when they met in Singapore who agreed to “re-energize APEC’s work on structural reform, building on the Leaders’ Agenda to Implement Structural Reform”.
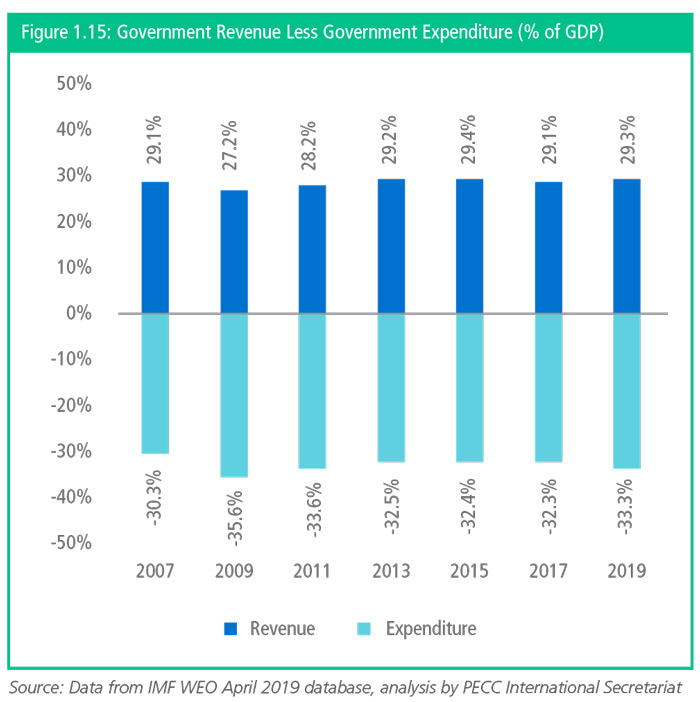
As shown in Figure 1.15 in 2009, governments in the Asia-Pacific increased expenditure from 32.2 percent of GDP to 35.6 percent.
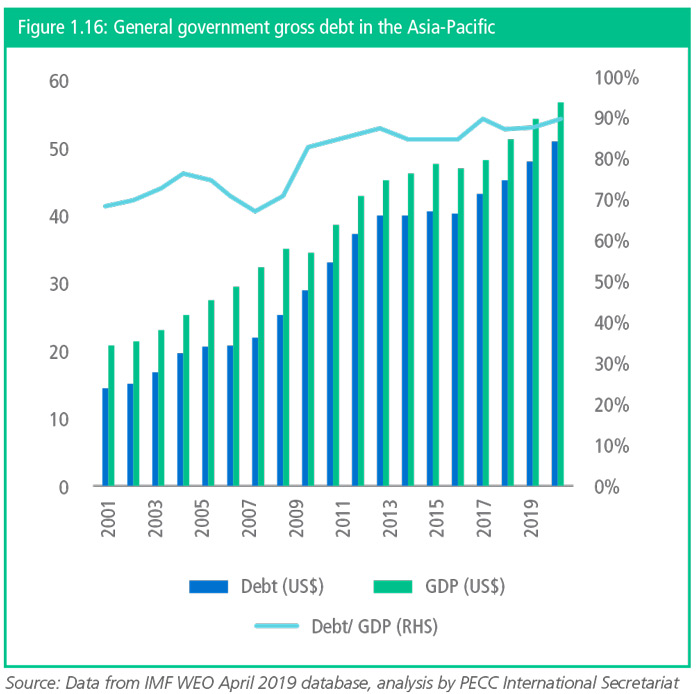
At the same time, government revenues decreased from 29 percent Figure 1.18: Sales of Foreign Affiliates of GDP to 27.2 percent – running substantial fiscal deficits. Over the past decade there has been some restoration of fiscal space, today government expenditure is around 33.3 percent of total GDP and revenue at 29.3 percent. However, in the years since the recovery got underway, only 14 of the economies included here have run fiscal surpluses for at least one of the years, and only 3 have run surpluses for all of them. While the recovery has been underway for a sustained period, public balance sheets in many instances are weaker than they were before 2008. As shown in Figure 1.16, public debt levels have been increasing over the past decade, with gross government debt has increasing from 70 to 90 percent of GDP.
According to estimates by the Institute of International Finance (IIF), global debt levels now stand at around $246.5 trillion, almost 320% of global economic output.9 The non-financial corporate and government sectors have seen the biggest rise in debt levels since 2007. While the IIF notes that while corporates overall in the United States have significant cash reserves to service their debt, smaller to mid-size firms are in a weaker position.
Complementary Measures to Stalling Growth
However, a troubling characteristic of the post-GFC period has been an inability to move out of the stimulus stance. Growth in the post Global Financial Crisis period has been supported by massive injections of liquidity into the financial system. In turn, this should feed into the real economy through capital expenditure with the creation of jobs and new productive capacity. While the US economy has been going through an its longest expansion in history, some argue that it has been a surprisingly weak recovery with GDP per capita income growing by only 1.5 percent a year over the past 10 years compared to 3.3 percent in previous expansions.
This year’s G20 Finance and Central Bank Governors Communique highlighted the need for carefully calibrated macroeconomic and structural policies so address excessive imbalances and mitigate the risks to achieving the G20 goal of strong, sustainable, balanced and inclusive growth. They also highlighted excessive corporate savings as a concern – pointing to miscalibrated fiscal policies, and barriers to trade in goods and services. While there are clear and present challenges to the immediate outlook that may necessitate fiscal and/ or monetary stimulus depending on individual circumstances, the critical point is that structural reforms remain desperately needed. These require a level of political leadership not now evident.
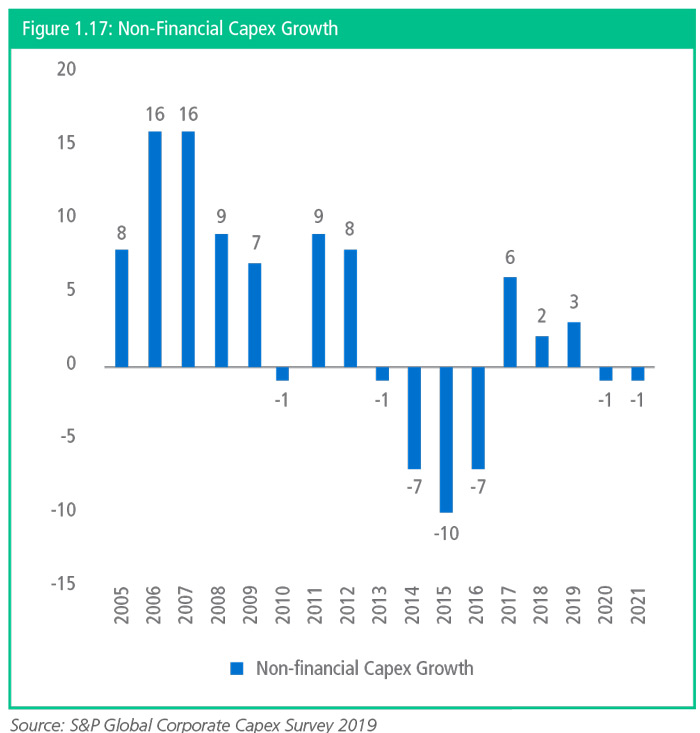
As pointed out by G20 Finance Ministers and Central Bank Governors, there is significant money in the corporate sector or as they put it ‘excessive saving’, however, capital expenditure remains disappointing. As shown in Figure 1.17, after successive years of decline, capital expenditure finally picked up in 2017, however, that growth slowed to 2 percent in 2018. While expectations are for growth of 3 percent this year, it is expected to contract once again in 2020 and 2021. As the Global Corporate Capex Survey 2019 puts it “the broader reality is that corporate capex has been a perennial disappointment in this economic cycle, and all the more so given large and sustained monetary stimulus, cuts in corporate taxation, and plentiful balance sheet cash.”
Detailed analysis of this phenomenon in an IMF Working Paper finds that this is not limited to any one economy, and is “driven by increased ability of large, publicly listed firms across advanced economies to extract larger profits and expand in size over time while limiting payouts to shareholders and taxes.” Supporting the conclusion on the nature of growth since at least 2008, “such sustained gains in profitability have not spurred higher investment in new fixed capital, leaving firms instead with growing stocks of liquid assets on their balance sheets.”
These firm level phenomena are also found to have a strong influence on various aggregate structural trends such as the decline in labor income shares, declining investment and productivity growth. This indicates misalignments in incentives that encourage this behavior. For example, evidence suggests that firms with large holdings in cash reserves also saw the largest gains in profitability, market valuation and R&D spending. They also limited dividend payouts in favor of share buybacks, reduced leverage and managed to reduce their effective tax rates. The evidence therefore points at a number of potential causes for rising corporate saving to be explored - with technology, globalization, governance and tax management strategies likely all playing a role.
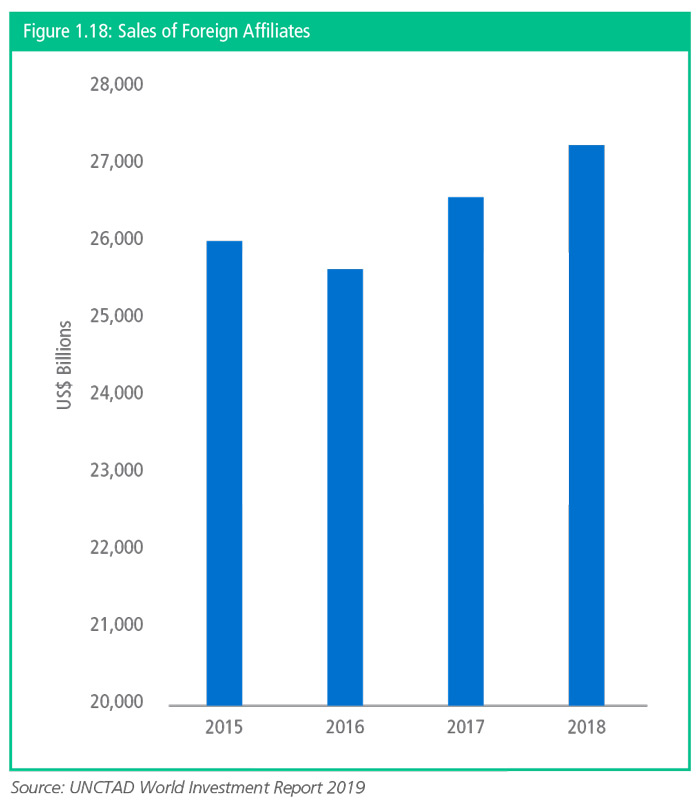
Part of those tax management strategies are related to how and when firms generate income in overseas markets – taxes are only paid when those earning are repatriated. Moody’s estimates that the cash reserves of the US corporate sector at $1.69 trillion at the end of December 2018, down 15.2% from a record peak of $1.99 trillion a year earlier. This largely came as a result of the capital expenditures of around US$851 billion, dividend payments of US$412 billion, share buybacks of $467 billion and acquisitions of US$405 billion. However, this may well be a one-off as a result of the US tax reforms in 2017. These numbers relate to the US corporate sector, but the changed structure of firms is a global phenomenon, UNCTAD estimates that the global sales of foreign affiliates were around US$27 trillion in 2018 as shown in Figure 1.18.
While government stimulus measures are understandable under the current circumstances, it would be a lost opportunity to not consider how to improve the ‘quality’ of growth through significant structural reforms. Such reforms might seek to remove incentives for firms to hold such large reserves of cash and incentivize early capital expenditures over share buybacks as well as improving corporate governance.
APEC’s focus on quality growth and structural reform has continued through the post GFC period with the adoption of the APEC Leaders’ Growth Strategy in 2010. These were then reinstated after they expired with the APEC Strategy for Strengthening Quality Growth as well as the Renewed APEC Agenda on Structural Reform (RAASR). The latest iterations will be assessed in 2020 which provides an ideal opportunity for serious reflection on whether the current modalities are helping regional economies to meet their goals and what more can be done given the changing context as well as the severity of the challenges that lie ahead.
Under its 2015 Renewed APEC Agenda for Structural Reform member economies developed individual action plans setting out their own priorities through to 2020 to reduce inequality and stimulate growth in their economies, and contribute to APEC’s overarching goal to promote balanced, inclusive, sustainable, innovative and secure growth, through measures in line with the following pillars:
- more open, well-functioning, transparent and competitive markets;
- deeper participation in those markets by all segments of society, including MSMEs, women, youth, older workers and people with disabilities;
- sustainable social policies that promote the above-mentioned objectives, enhance economic resiliency, and are well-targeted, effective and non discriminatory.
This modality reflects APEC’s tried and tested formula of ‘individual action plans’ that characterized its partial success in trade and investment liberalization and facilitation in its early phase of development. However, that approach also included collective actions plans. In considering the next phase of its work on structural reform APEC might consider structural reform programs to be undertaken by other APEC for a. For example, APEC’s Economic Committee has been working with the APEC Finance Ministers process on a number of issues as well as with the Human Resources Development Working Group. However, these iterative activities would benefit from clear guidance and a strategic plan of action. Moreover, a more pertinent question is whether and how APEC economies might work together to reduce the structural risks emerging in the regional and global economy described in this report.
Revisiting the APEC Growth Strategy
While much attention has been paid to the ongoing trade conflict, significant changes have been taking place to the economic structure both within and between regional economies.
In 2009, the Pacific Economic Cooperation Council (PECC) established a task force to ‘assess the region’s progress in fighting recession, rebalancing economic structures, and managing sustained recovering…[and to] anticipate the critical policy changes that will be required in the Asia-Pacific to move from crisis management to stable growth.’ The task force’s recommendations came after the recovery from the 2008-2009 crisis was already underway but incomplete. It called for structural reforms that change economic relationships both within and among economies. Over the 10-year period, PECC has continued to track change on what has become known as the growth strategy.
Figures 1.18 to Figure 1.22 show the changes in the structures of regional economies since immediately before the pre-Global Financial Crisis period (2007). Some immediate trends stand out. The first, as already noted above is the general increase in government expenditure that has characterized growth in many regional economies in the post Global Financial Crisis period.
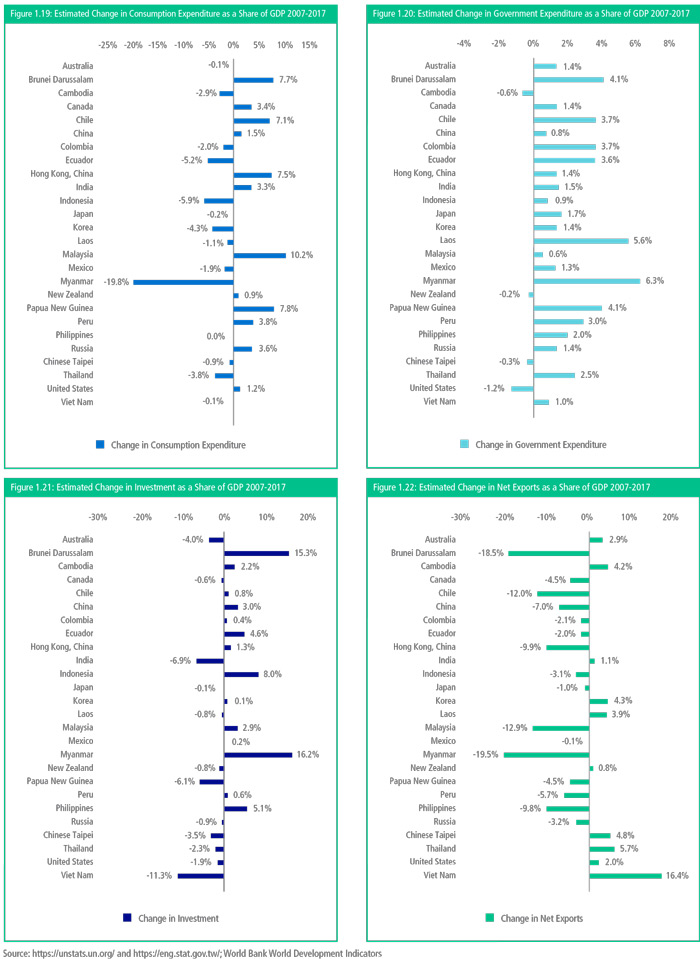
Secondly, with one or two notable exceptions, the extent to which net exports have not been as big a driver of growth for regional economies as they were prior to the crisis. Thirdly, the extent to which domestic demand, consumption or investment expenditure has been driving growth in the region.
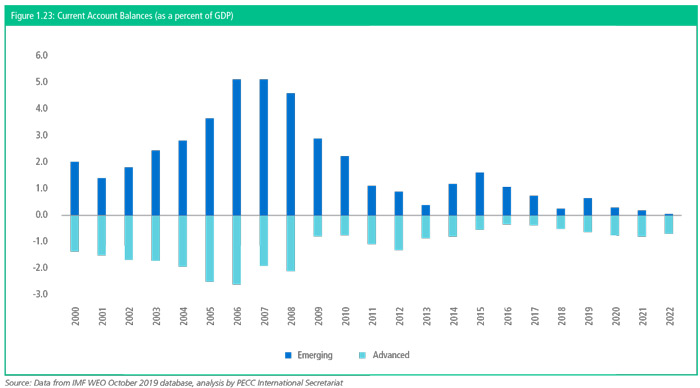
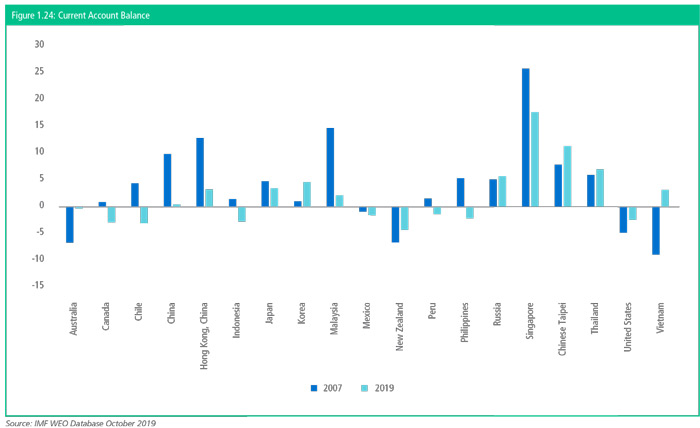
In summary, there are significant changes to the internal structure of economies that in turn has impact balances among regional economies. As shown in Figure 1.23, the current account balance between the region’s emerging and advanced economies has narrowed considerably. In 2006 when they were at their peak, the region’s emerging economies were running current account surpluses equivalent to 5.1 percent of GDP and the region’s advanced economies 2.6 percent. Since then they have narrowed to 0.2 percent and 0.6 percent respectively.
The change in consumption patterns is deeply related to one of the underlying structural features of the region - high savings rates among Asian economies. While both Japan and the United States are considered as high-income advanced economies, Japan’s gross national savings averaged 29 percent of GDP over the past quarter of a century while the United States has been at 18 percent. At the same time, Japan’s investment to GDP ratio has been around 27 percent while the US has been at 21 percent. Further work done by PECC in the aftermath of the Global Financial Crisis looked at consumption and savings trends across the world and their likely trajectory into the future.12 It argued that private consumption growth is determined by trends in GDP growth, household income growth, household saving rates, and household wealth but that the relative importance of these factors differs greatly from economy to economy. However, as far as savings rates are concerned, the main determinants of the domestic saving rate in developing Asia are the age structure of the population (especially the aged dependency ratio), income levels, and the level of financial development. It noted that public expenditures on social services including spending on pensions as well as education and health services have generally been low in developing Asia, averaging less than 5% of gross national disposable income, far lower than in OECD economies which averaged around 15% of GDP on social services and pensions.
While the econometric analysis suggests that improving social safety nets alone will not necessarily reduce saving rates and stimulate consumption, doing so is desirable to obviate the need for people to worry about unexpected contingencies, thereby enhancing household welfare and putting household income to more productive use – in short, improving people’s quality of life.
APEC continues to promote inclusive growth through multiple avenues including promoting universal health care. At the first United Nations High-Level Meeting (UNHLM) on Universal Health Coverage (UHC), the APEC Health Working Group issued a statement on universal health care.
This idea of ‘transpacific imbalances’ has long been a concern of this report and the broader Pacific Economic Cooperation Council. In 2005, this report’s predecessor had warned that “the region continues to be characterized by an acute imbalance in trade and financial flows” and that “there is a growing risk of conflict between Washington and Asian trading partners.”
Given the general lack of attention to the domestic dimensions to imbalances, it needs to be reiterated that “current account imbalances reflect private economic decisions to save and invest and are no economic problem in themselves… however, from past experience, risk generating negative political reactions in deficit economies.”14 This was an issue that the PECC discussed at great lengths especially in the lead up to the Global Financial Crisis. At its General Meeting in 2006, in considering whether the imbalances were ‘a disaster in the making’ several important points arose:
- The problem is in the structural policy fields, competitiveness market field, openness market field, regional market field, and labor market field;
- Focusing only on one dimension will prejudice our recommendations;
- What is needed is simultaneous and coordinated policy adjustments;
- The focus should be on policy cooperation instead of policy coordination because you cannot deliver coordination. Policy cooperation means that there is a dialogue in the right fora, and that there is greater understanding of each other; and policy changes in individual economies should reinforce each other.
- The root of the problem lies in the international financial architecture.
While re-emphasizing that imbalances are far from the levels they had been in 2006, those earlier warnings had not been heeded and the world went through a devastating crisis. These recommendations are essential as part of a grand bargain to avoid further escalation in the trade conflict. Moreover, looking further ahead to forecasts for 2020-21, there is an expectation that the region’s emerging economies will run balanced or current account deficits. These reflect important structural changes within economies – changes to investment-savings balances at the household, government and corporate levels.
The change is also seen for individual economies in the region. Whether economies had been running current account deficits or surplus in the pre-Global Financial Crisis period there have been significant changes as shown in Figure 1.24 below, and most of these changes have reduced the imbalances as a percent of GDP. Indeed, some economies that had been previously been running current account surpluses are in 2007 were expected to run deficits this year and vice-versa.
Sustainable Growth
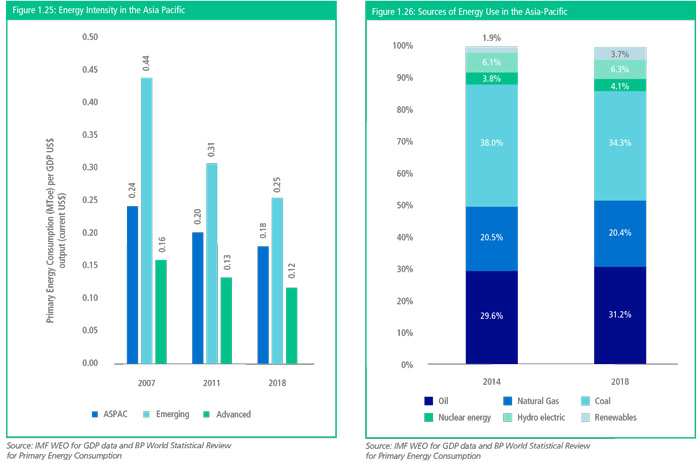
As part of the APEC Growth Strategy adopted in 2010, APEC economies agreed to ‘seek growth compatible with global efforts for protection of the environment and transition to green economies.’ Part of the that work included the assessment of the potential for reducing the energy intensity of economic output in APEC economies between 2005 and 2030, beyond the 25 percent aspirational goal already agreed to by the APEC Leaders in 2007. In 2011, they agreed to further reduce APEC’s aggregate energy intensity by 45 percent by 2035 and in 2014 agreed to double the share of renewables in the APEC energy mix by 2030.
In 2007 when APEC leaders originally set their target, the energy intensity for the region as a whole was 0.24 million tons of oil equivalent for every US$1 billion of GDP output. By 2011, when the target was revised this had already dropped to 0.20 MTOE, by 2018, this was expected to further drop to 0.18 MTOE or a reduction of 26 percent. These improvements are coming from both emerging and advanced economies, with advanced economies improving energy intensity by 25 percent and emerging economies by close to 42 percent.
While not addressing the issue of climate change and carbon dioxide emissions directly, in its 2012 World Energy Outlook, the International Energy Agency (IEA) argued that a reduction in global carbon dioxide (CO2) emissions from the business-as-usual path is likely to be driven largely by energy-efficiency measures. In their projections, the IEA forecasts that by 2035, energy efficiency policies will account for around 70 percent of the reduction in CO2 emissions and thus will have a much more significant effect than either renewables or nuclear energy.
In 2014, when APEC leaders made their commitment to double the share of renewables in their energy mix, as shown in Figure 1.25 approximately 1.9 percent came from renewable sources. By this year, this had increased to 3.7 percent. As with the goal for energy intensity, after a thorough review of commitments made under the Paris Agreement and elsewhere, APEC may want to review and step up its commitments.
Any global effort to address climate change will require the successful engagement of all the economies that participate in APEC. As has become mantra, its 21 member economies are home to around 2.8 billion people and represent approximately 59 per cent of world GDP and 49 per cent of world trade in 2015. According to the APEC website, its membership accounts for 60 percent of global energy demand and includes four of the world’s five largest energy users.
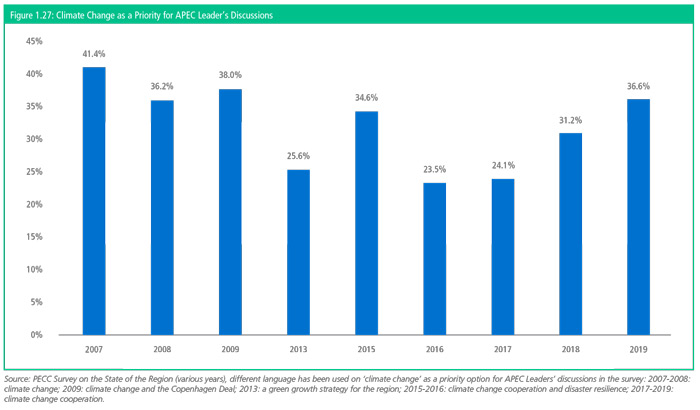
While climate change did not make it to the list of top 5 priorities for APEC leaders to discuss at their meeting in Santiago (see below), a growing share of the regional policy community has been selecting climate change as an issue for APEC leaders to discuss over the years. From a high of 41 percent in 2007 when the group made its commitment to reduce energy intensity at their Sydney meeting, climate change had fallen as an APEC priority, aside from a small peak in 2015 when the Paris Conference of the Parties was ongoing. But this may not reflect the importance of the issue, but because APEC is not regarded as the most appropriate vehicle for such discussions. In fact, however, achieving climate goals and setting a robust and environmentally sustainable growth path is key and critical to Asia-Pacific economic cooperation.
As has been discussed elsewhere in this report, growth in the post-Global Financial Crisis era has largely been supported by extraordinary stimulus measures. Funds channeled through the financial system – with the hope that these will reach the real economy. According to the United Nations Framework Convention on Climate Change Standing Committee on Finance estimated global total climate-related finance flows at around USD 456–681 billion in 2016 or an increase of 17 per cent over previous years. 17 This seems painfully limited given current needs. For example, annual global investment in electricity for example averaged US$712 billion annually from 2007-2015. Moreover, to meet Sustainable Development Goal 7 to “Ensure access to affordable, reliable, sustainable and modern energy for all”, Asia alone requires over US$10 trillion in investment in electricity from 2016 to 2030.
As discussed in Chapter 2, there is less a question of whether APEC members should address climate change issues but rather how. As an organization primarily concerned about trade and economic cooperation, moreover there are risks that APEC merely duplicate work that is already being done by other organizations nor is it well suited to address. APEC for its part has contributed usefully, for example in reaching agreement on environmental goods. Such efforts are critical to reduce the cost of more environmentally efficient products. It also has an ongoing Environmental Services Action Plan. These complement rather than duplicate efforts ongoing elsewhere. However, APEC will at least be under pressure from stakeholders to do more.
Priorities for APEC Leaders
When APEC leaders meet in Santiago they do so against a backdrop of uncertainty over the economic outlook and tension among APEC members. Even as APEC celebrates the 30th anniversary of its foundation, some of the fundamental principles that have underpinned APEC’s work for three decades are being questioned. These are however, the very challenges that APEC was created to address. In setting out his rationale for its creation, late Australian Prime Minister Bob Hawke said that “serious cracks are appearing in the international trading system which have major implications for the future health of both our region and the world economy:
• bilateral trade pressures associated with the significant trade imbalances between a number of regional countries and the United States;
• a trend towards the formation of bilateral or regional trading arrangements which run the risk of undermining a truly multilateral trading system; and
• there are fundamental tensions within the GATT framework of multilateral trade, of which the recent Montreal deadlock is but the latest manifestation.”
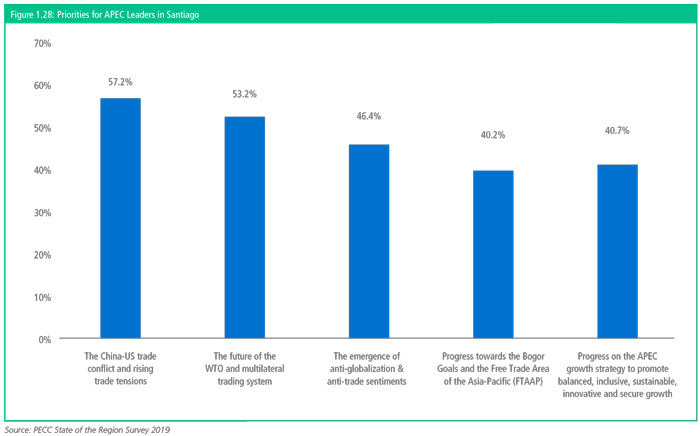
A few minor word changes to those paragraphs and those cracks could well describe the situation today. The system did not break, and APEC played a fundamental and often underappreciated role in filling in those cracks. Out of a list of 15 possible priorities, the top 5 selected by the regional policy community for discussion by APEC leaders when they meet in Santiago were:
- The China-US trade conflict and rising trade tensions
- The future of the WTO and multilateral trading system
- The emergence of anti-globalization & anti-trade sentiments
- Progress towards the Bogor Goals and the Free Trade Area of the Asia-Pacific (FTAAP)
- Progress on the APEC growth strategy to promote balanced, inclusive, sustainable, innovative and secure growth
It is clear that PECC survey respondents would like the leaders to almost exclusively focus on how to overcome current trade tensions, how to address anti-globalization sentiments within the public, and how to both reform and strengthen the broader WTO system as well as promote freer trade at the regional level.
It is clear that the regional policy community believes that APEC could and should play a constructive role in resolving some of the fundamental challenges facing the global economy today. APEC’s unique focus on cooperation that avoids legalistic formal settings should be harnessed to its maximum potential allowing for constructive dialogue at all levels of government. One issue that is reaching a critical point is the status of the WTO’s Appellate Body. As discussed in last year’s report, by December this year, the terms of 2 of the 3 remaining Appellate Body members will have completed their terms. This leaves the WTO Dispute Settlement process vulnerable to collapse. One interim solution is for economies to simply agree to abide by the decision reached by the Panel – as Indonesia and Vietnam have done in one case.19 The longer discussion seems to rest on three critical issues:
- how to improve the efficiency of the dispute settlement process
- how to update trade rules
- how to improve the monitoring function
There are other ongoing processes to try to break the deadlock in the rules making function of the WTO through various plurilateral initiatives such as the Joint Statement Initiative on E-commerce. APEC could play a fundamentally important role in this with its well-developed institutional processes to support such work even if not all APEC members are ready to join such initiatives.
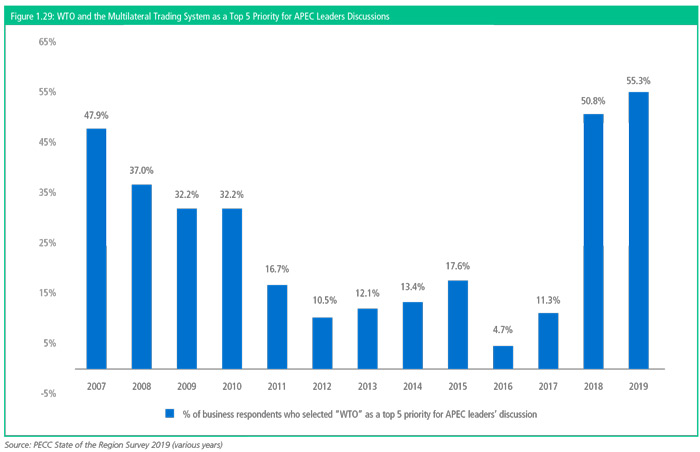
As shown in Figure 1.29, the regional business community did not consider the WTO and multilateral trading system a priority for APEC leaders’ discussions for many years. From a high of 48 percent of respondents in 2007, the percentage of business respondents who thought that APEC leaders should discuss the WTO had dropped to just 5 percent in 2016. However, the willingness of the US to ignore long-held understanding of rules and unilaterally and selectively apply tariffs have seen the percentage of business respondents rise from 5 percent in 2016, to 51 percent last year to 55 percent his year.
In reflecting on the Bretton Woods Institutions at 75, Dr Mari Pangestu, former Indonesian Minister of Trade, argued for a topdown and bottom-up approach to ensuring that the WTO was fitfor- purpose in the 21st century. Top down input would come from leader level processes such as the G20 and APEC, while bottom-up come from the working groups in the G20 that already feed into the WTO process as well as complementary processes such as the mega-regionals that are already negotiating many of the new issues.
APEC could play a fundamental role in this process. It already has a head start in doing so. In 2015 APEC formally established the Information Sharing Mechanism on Regional Trade Agreements (RTAs)/Free Trade Agreements (FTAs) which allow APEC members to engage in a regular dialogue on the WTO Plus Elements of concluded agreements. While this mechanism was established as part of efforts to work towards an eventual Free Trade Area of the Asia-Pacific one of its stated purposes is to “support the multilateral trading system and WTO by promoting and encouraging, through information exchange and active participation in the WTO RTA Transparency Mechanism, high quality comprehensive FTAs that serve as building blocks for broader regional and multilateral trade liberalization.”
While the overall prognosis for economic growth of this report is negative and it is clear that the Asia-Pacific policy community is deeply concerned about future trajectory of the regional and global economies and the system of norms, rules, and institutions that undergird international trade, there is some reason for guarded optimism. The swift conclusion of the US-Japan trade agreement shows that there is still forward momentum on trade liberalization. Indeed, it is all too easy to forget that Japan now has bilateral trade agreements with both the US and the EU, which combined account for 52 percent of the global economy. More importantly, such deals also provide momentum to other agreements. For the Asia-Pacific, the Regional Comprehensive Economic Partnership (RCEP) has yet to be concluded. It has long been considered a pathway to an eventual Free Trade Area of the Asia-Pacific along with the CPTPP. There are other building blocks in this. Chile, as this year’s host of APEC is a member of both the CPTPP as well as the Pacific Alliance. The Pacific Alliance has held ambitions to be more than a trade agreement among a handful of neighbors. They are negotiating associate membership with Australia, New Zealand and Singapore. There have long been thoughts of the Pacific Alliance negotiating an eventual agreement with ASEAN.
As important as these regional deals are to removing barriers to trade and leveling the playing field, especially for small businesses, APEC can play a fundamental role in bringing the lessons learnt in these processes back to the multilateral table. A world fragmented into different blocks will be costly for consumers and businesses alike and draws a line down the middle of the Pacific. The world lacks the intellectual and political leadership that was evident when the Bretton Woods institutions were created. These established a system that allowed for others to rise. They are not without their weaknesses. Voting rights and monopoly of leadership positions are obvious examples. However, they established clear rules of the road for participants to follow. At a time when the economies are more interconnected than ever through digital technologies and facing common existential threats such as pandemics and frequent and harsher natural disasters, the governance systems that facilitate coordinated responses need to be strengthened not weakened. There is a grave risk of a fallacy of composition – this makes processes like APEC more valuable than ever because of its informal nature – however, as discussed in the following chapter, this needs to be strengthened if it is to be truly effective.