Chapter 2 - Views on promoting inclusive growth and structural reform
CONTRIBUTED BY MR. EDUARDO PEDROSA, PECC INTERNATIONAL SECRETARIAT
Twenty-one years after APEC Leaders agreed to achieve ‘free and open trade and investment in the Asia-Pacific no later than the year 2020’ the Bogor Goals remain the region’s top priority, according to the survey of regional opinion-leaders conducted from 21 September to 16 October 2015.
PRIORITIES FOR APEC LEADERS
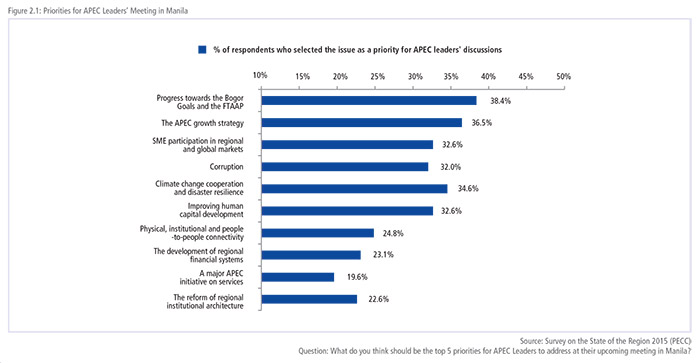
The survey findings also show broad support for the themes set by this year’s APEC host, the Philippines, which has placed a high priority on ways to promote more inclusive growth. The top 10 priorities for APEC Leaders to discuss at their meeting in Manila are shown in Figure 2.1 below.
While there was broad agreement in the policy community on the priorities there were some issues where there were significant differences – either among the Asia-Pacific’s sub-regions or between different stakeholder groups. For example, 27 percent of government respondents selected ‘physical, institutional and people-to-people connectivity’ as a top 5 priority compared to only 18 percent of business respondents.
PROGRESS TOWARDS THE BOGOR GOALS AND THE FTAAP
Figure 2.1 below shows the priorities for APEC Leaders’ discussions in Manila in order of importance. Thirty-eight percent of respondents to PECC’s survey selected progress towards the Bogor Goals and the Free Trade Area of the Asia-Pacific as a top 5 priority for APEC leaders’ discussions. Since the Bogor Goals were adopted they have been joined by the vision of the “Free Trade Area of the Asia- Pacific” (FTAAP). In 2010, APEC Leaders stated that the FTAAP should be pursued as a ‘comprehensive free trade agreement by developing and building on ongoing regional undertakings, such as ASEAN+3, ASEAN+6, and the Trans-Pacific Partnership, among others’ and in 2014 in Beijing they adopted a roadmap for its achievement.
APEC GROWTH STRATEGY
In 2010, in response to the Global Economic Crisis, APEC Leaders agreed that growth in the region needed to be more balanced, inclusive, sustainable, innovative, and secure. Since then the APEC Growth Strategy has consistently been ranked as a high priority for leaders’ discussions – this year was no exception with 37 percent of respondents selecting it as a top 5 issue making it the second highest priority. However, results from previous surveys have also shown low levels of satisfaction with actions taken to promote the 5 attributes of the growth strategy, especially inclusivity. As such, the review of the strategy this year gives an opportunity to refocus efforts and consider how to achieve higher quality growth in light of the changes brought about by the Global Economic Crisis.
SME PARTICIPATION IN REGIONAL AND GLOBAL MARKETS
One of the key themes of this year’s APEC meetings has been finding ways to make the benefits of the economic integration process more accessible to all stakeholders, in particular micro and small and medium enterprises (MSMEs). The survey found broad support for this work with the participation of small and medium enterprises in regional and global markets rated as the third highest priority for APEC Leaders’ discussions. The Boracay Action Agenda agreed by APEC Trade Ministers at their meeting in May 2015 set out an ambitious plan to facilitate the participation of MSMEs in global value chains as well as their direct access to regional markets through the removal of cumbersome rules and procedures.
ADDRESSING CORRUPTION
The fourth highest priority was addressing corruption. APEC work on this issue has been increasing in recent years with the establishment of the APEC Network of Anti-Corruption Authorities and Law Enforcement Agencies (ACT-NET) and the Beijing Declaration on Fighting Corruption. This was an issue where there was significant variation among stakeholders, while 38 percent of respondents from the business community thought that it should be a top 5 priority for discussion compared to only 28 percent from the non-government sector.
CLIMATE CHANGE AND DISASTER RESILIENCE
The fifth highest priority was climate change and disaster resilience. Given the region’s vulnerability to climate change and exposure to disasters a focus on this issue would be timely especially with the holding of 21st Conference of Parties to the 1992 United Nations Framework Convention on Climate Change (UNFCCC) in Paris just a month after the APEC Leaders’ meeting in Manila.
DIVERGING VIEWS ON PRIORITIES
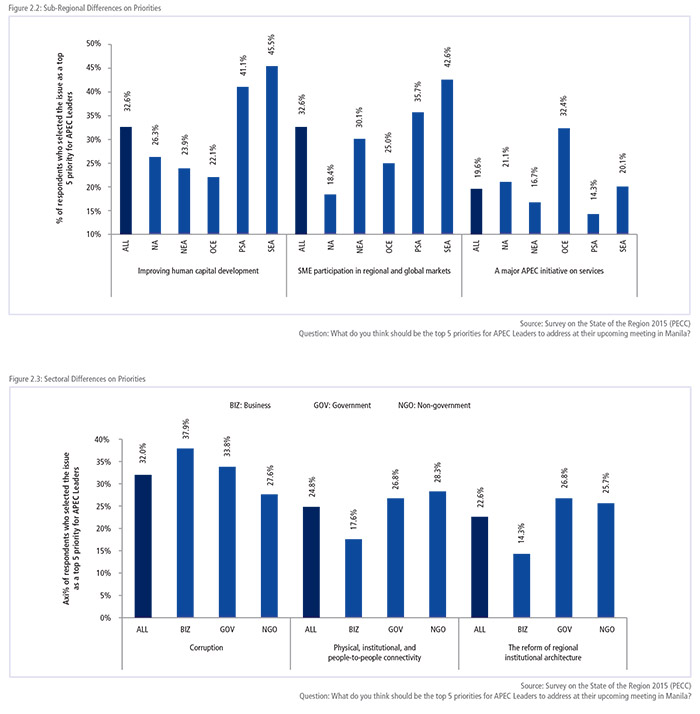
While there was broad agreement on priorities, some issues divided the regional policy community more than others as shown in Figure 2.2. For example, while 46 percent of respondents from Southeast Asia and 41 percent from Pacific South America had selected improving human capital as a priority for APEC Leaders while only 22-26 percent of respondents from Oceania, Northeast Asia and North America did.
A similar pattern was shown for small and medium enterprise participation in regional and global markets, 43 percent of respondents from Southeast Asia had selected this as a top 5 priority for APEC Leaders and only 18 and 25 percent for those from North America and Oceania respectively.
The third issue with the biggest difference in views is a major APEC initiative on services. While it was overall ranked as the 9th highest priority for APEC Leaders to address with 19 percent of respondents selecting it as a top 5 issue, it was the 3rd highest priority for those from Oceania with 32 percent compared to only 14 percent from Pacific South America.
In such a diverse region it should not be surprising that there are significant differences in views, what is perhaps most interesting is how regional processes such as APEC are able to bring economies at different levels of development and varying interests together around a common set of interests.
DIVERGING VIEWS ON PRIORITIES: BY SECTOR
As with views from the sub-regions of the Asia-Pacific, there were also some significant differences in priorities depending on whether respondents were from business, government or non-government (academic, civil society and the media).
While physical, institutional and people-to-people connectivity was a much lower priority for business respondents, with only 18 percent selecting it as a priority for APEC Leaders’ discussions, 28 percent of those from the non-government sector selected it as a priority. Conversely, while the reform of regional institutional architecture was the 10th highest priority for APEC Leaders’ discussions overall, it ranked very lowly for business respondents with only 14 percent selecting it as an issue which made it the 21st out of a list of 23 possible issues for Leaders’ to address compared to around 26 percent of respondents from government and nongovernment respondents who ranked it as the 8th highest priority.
PROMOTING INCLUSIVE GROWTH
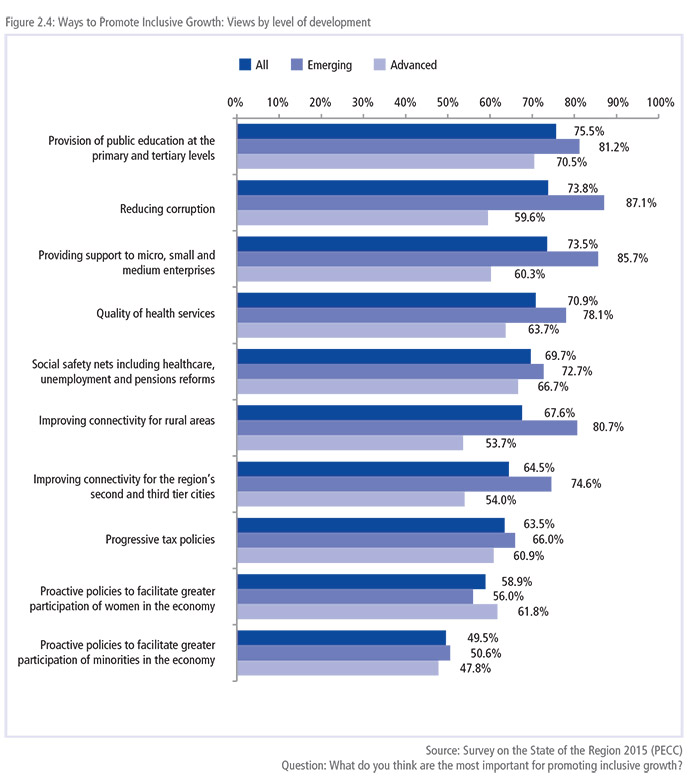
The overarching theme for this year’s series of APEC meetings has been inclusive growth. Previous PECC surveys have indicated relatively low levels of satisfaction across the region with efforts to make growth more inclusive. According to the results of this year’s survey, the top 5 most important ways to promote inclusive growth were:
Provision of public education Reducing corruption Providing support to micro, small and medium enterprises Quality of health services Social safety nets including healthcare, unemployment and pensions reforms
All of these are addressed in some way by the priorities suggested for APEC Leaders’ discussions earlier identified. However, as with the priorities there were some important differences in views in the region.
Figure 2.4 on left shows the percentage of respondents by their economy’s income level (advanced or emerging15) who considered each of the issues important or very important for promoting inclusive growth. Many more respondents from emerging economies put a high level of importance of reducing corruption to promote inclusive growth (87 percent) compared to those from advanced economies (60 percent). The only issue on which respondents from advanced economies rated higher than those from emerging economies was policies to facilitate greater participation of women in the economy.
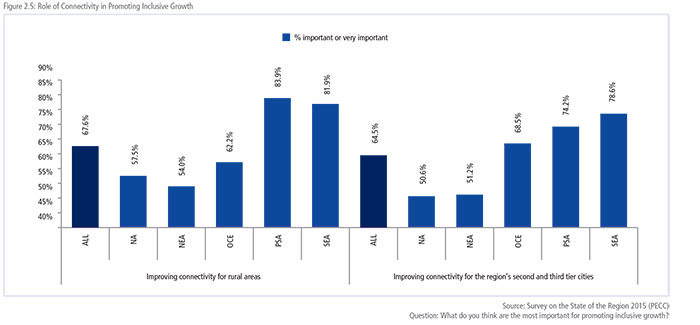
Another issue that divided regional opinions was connectivity. The question included two options on the role of connectivity in promoting inclusive growth: connectivity for rural areas and connectivity for second and third tier cities. The distinction was made because of the significant differentials between urban and rural poverty levels as well as the relatively lower levels of connectivity that exist between large urban centers and second and third tier cities in the region.
As shown in Figure 2.5, more than 80 percent of respondents from Pacific South America and Southeast rated improving connectivity for rural areas as important to very important to promoting inclusive growth compared to 54 to 62 percent of respondents from North America, Northeast Asia and Oceania. A very similar pattern of divergence was seen in the results for improving connectivity of the region’s second and third tier cities.
Looking at the issue from the perspective of income levels, respondents from advanced economies ranked the two connectivity issues 8th and 9th while those from emerging 4th and 7th. All this is to say is that in such a diverse region as the Asia-Pacific where cooperation is, of necessity, characterized by consensus, there is a need for flexibility in selecting priorities as well a need for ‘community building’ on issues that may be an urgent issue for some members but less so for others.
VIEWS ON THE ECONOMIC OUTLOOK
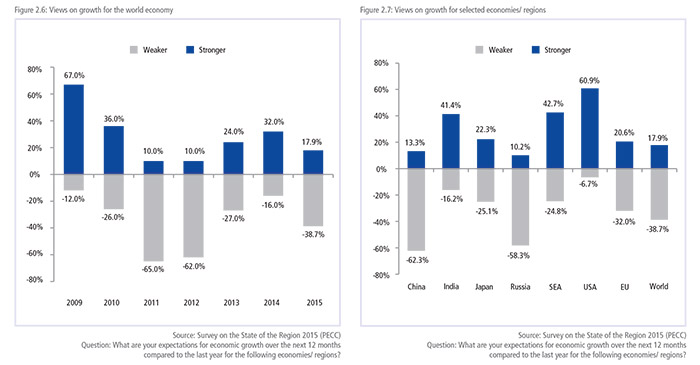
Views on the economic outlook have turned towards the negative with 39 percent of respondents expecting weaker growth for the world economy over the next 12 months and 18 percent expecting stronger growth with the balance expecting growth to remain the same as this year. Respondents remain most pessimistic about China with 62 percent expecting weaker growth over the next 12 months. This is broadly in line with forecasts, but it is worth pointing out that slower growth for China means slowing from a high of 10 percent growth in percent year as down to a more sustainable level of 6 to 7 percent.
Respondents remain very positive on the US economy with 61 percent expecting stronger growth. There was also a broad optimism about emerging markets with 41 percent expecting stronger growth for India and 43 percent for Southeast Asia.
RISKS TO GROWTH
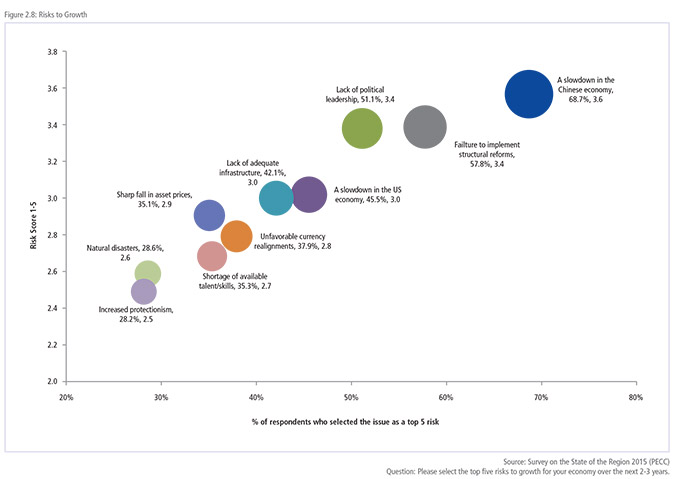
The top three risks to growth in the region are the same as in 2015: a slowdown in the Chinese economy; a failure to implement structural reforms; and a lack of political leadership. A failure to implement structural reforms has moved from being the third highest risk to growth to now being the second highest risk.
One problem with risks is that they come with two central dimensions – the likelihood of the risk and the seriousness of the risk. Figure 2.8 below shows the percentage of the respondents that selected the risk as a proxy for the probability or likelihood of the event happening and the seriousness that respondents assigned to the risk. For example ‘a slowdown in the Chinese economy’ was chosen as a top 5 risk by 69 percent of respondents who rated it as 3.6 on a scale of 1-5 while ‘failure to implement structural reforms was selected by 58 percent of respondents who rated it as a 3.4.
FAILURE TO IMPLEMENT STRUCTURAL REFORMS
The failure to implement structural reforms was the second highest risk to growth. 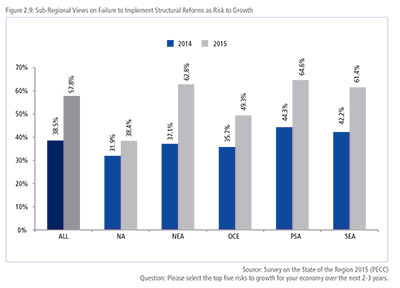 There were some sub-regional differences, for example it was the top risk for Southeast Asia with 61 percent of respondents selecting it as a top 5 risk to growth compared to 38 percent of North American respondents. Importantly, compared to last year’s survey results, a significantly higher percentage of respondent have selected it as a risk to growth, overall almost 20 percent more than in 2014 as seen in Figure 2.9. This places a high priority on the importance of structural reform agenda that APEC has been reviewing this year.
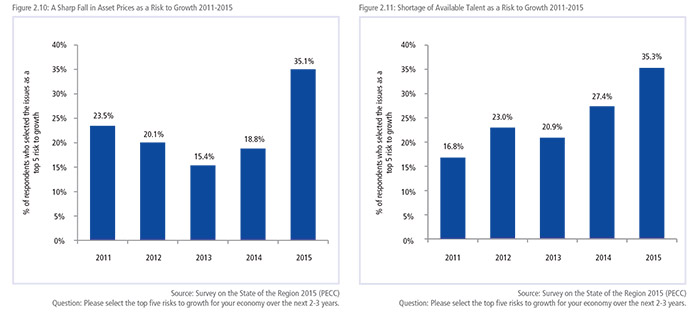
Two other risks stand out, not for the ranking in the list but because of the increase in the number of respondents selecting them as risks compared to 2014: a sharp fall in asset prices and the shortage of available talent and skills. As shown in Figure 2.10, 35 percent of respondents selected a sharp fall in asset prices as a top 5 risk to growth. This issue has been on the list of risks for 5 years and increased significantly from 19 percent last year; this should not be surprising given the volatility seen in market in recent months.
The number of respondents selecting a shortage of talent/skills as a risk to growth also increased sharply from 2014 to 2015, from 27 percent of respondents to 35 percent in this year’s survey. As discussed in Chapter 1, an inflection point in the region’s demographics has been reached with the working age population as a percentage of the total population reaching a peak in about 2012. The extent to which the problem is one of the skills available or total number of people available to fill positions needs further investigation.
ARE WE PREPARED FOR MARKET VOLATILITY?
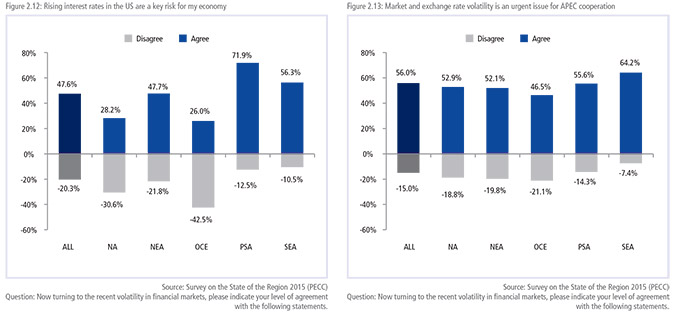
Given the volatility seen in markets around the region over the past few months it should be no surprise that a sharp fall in asset prices is perceived as a high risk to growth. Given the increased probability of a rise in US interest rates in the near future, the question is whether economies in the region have made sufficient preparations for the changes in global liquidity flows that this would entail.
Close to half of all respondents agreed that rising US interest rates were ‘a risk for my economy’ as shown in Figure 2.12 and 56 percent of respondents agreed that market and exchange rate volatility should be an urgent issue for APEC cooperation as shown in Figure 2.13. One thing worth bearing in mind, however, is that exchange rate adjustments ranked very lowly in the priorities for APEC Leaders’ discussions. One explanation for this seeming incongruence is that while the broad policy community might consider exchange rates an important issue for APEC to address, it is not necessarily something Leaders need to address – perhaps something that the APEC Finance Ministers could address as they did when they met in Cebu in September. Their joint statement gave a clear view on current volatility: “Disruptions in the financial markets and raising long-term potential growth are key challenges. We maintain our commitment to strengthen economic growth and promote financial stability in the APEC region… We reaffirm our previous commitments on monetary and exchange rate policies. We will refrain from competitive devaluation and resist all forms of protectionism.”
As shown in Figure 2.12, rising US interest rates was seen as a much higher risk for economies in Pacific South America and Southeast Asia with 72 and 56 percent of respondents from those sub-regions respectively agreeing with the statement ‘rising interest rates in the US are key risk for my economy.’ Similarly respondents from Pacific South America and Southeast Asia placed a much higher level of agreement on APEC addressing market and exchange rate volatility as shown in Figure 2.13.
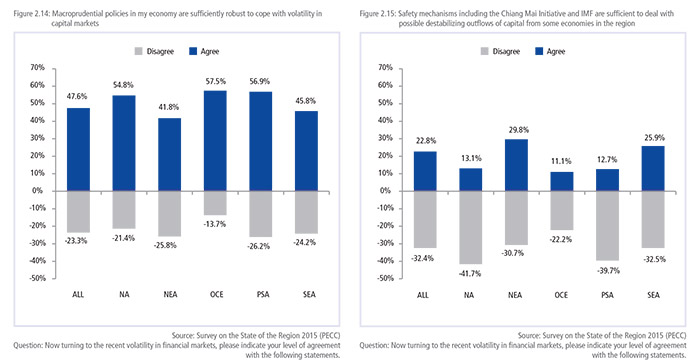
There was general agreement that economies in the region had sufficient macroprudential policies in place to cope with the volatility seen in capital markets as seen in Figure 2.1416. However, views on international safety mechanisms such as the Chiang Mai initiative and the IMF were much more negative as seen in Figure 2.15. In spite of the progress made with regional initiatives such as the Chiang Mai Initiative and reforms to the IMF, there remains skepticism in the region on the role they could play in the event of outflows of capital from the region. This places a high amount of burden on macroprudential and other policy tools available to policy makers – including the accumulation of large quantities of foreign reserves – no matter how ‘wasteful’ they may be.
PRIORITIES FOR STRUCTURAL REFORMS IN THE ASIA-PACIFIC
In such a diverse region the prescriptions on where and what structural reforms need to be implemented is critical. As shown in Figure 2.16 a high emphasis was placed on China, ASEAN members, and then respondents’ own economies with reforms in the US coming last in the list. This is not to say that respondents thought that structural reforms in the US were unimportant, far from it, 44 percent of respondents did think they were important or very important.
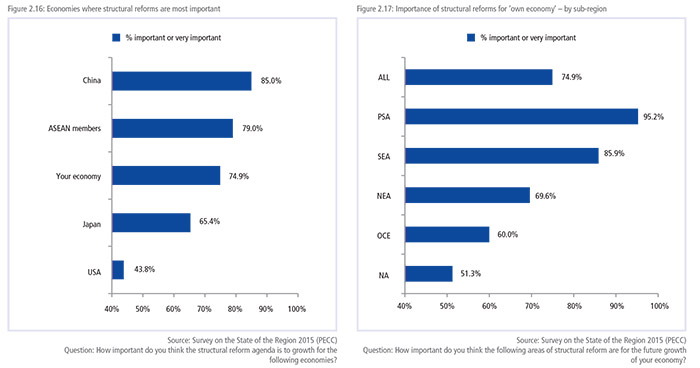
Respondents were also asked to rate the importance of structural reforms for their own economies. As shown in Figure 2.17 respondents from Pacific South America and then Southeast Asia gave a higher level of importance to structural reforms for their own economies compared to their counterparts in more developed sub-regions such as Oceania and North America.
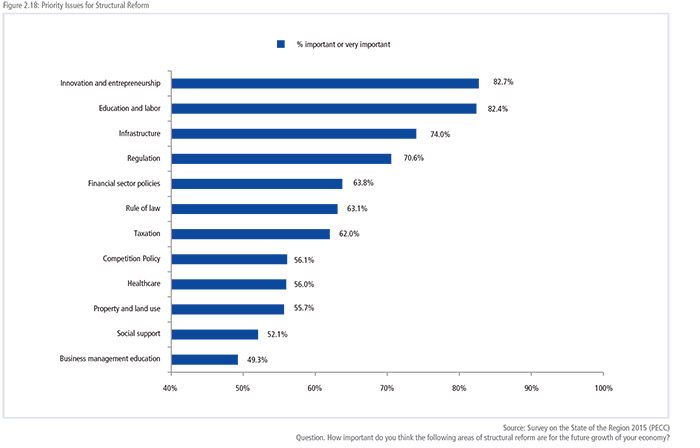
As shown in Figure 2.18 the most important areas for structural reform in the region were: innovation and entrepreneurship, education and labor; infrastructure; regulation and financial sector policies.
The question posed was: “How important do you think the following areas of structural reform are for the future growth of your economy?” As a general comment, respondents from emerging economies placed a much higher importance to structural reform across the board.
There were high levels of convergence among respondents on the importance of structural reforms in innovation and entrepreneurship as well as education and labor with a minimum of 70 percent of respondents from sub-regions rating them as important or very important.
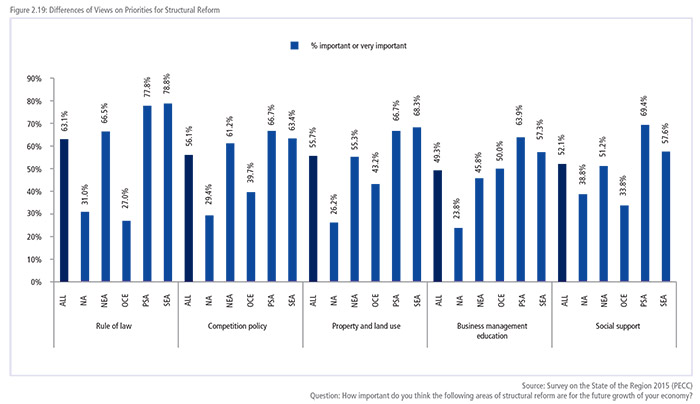
However, there were some sharp differences among respondents on what elements of structural reform were most important for growth for their economies. The issues with the largest divergence in views were: the rule of law; competition policy; property and land use; business management education; and social support.
For example, as shown in Figure 2.19, respondents from North America and Oceania gave relatively less importance to the rule of law to the future growth of their economies, whereas those from Southeast Asia, Pacific South America and Northeast Asia gave it a much higher priority. A similar pattern was evident for all the issues on which there were significant divergences in views with those from sub-regions with predominantly advanced economies giving lower levels of importance to issues compared to those from emerging economies.
Given these differences, APEC’s traditional approach of concerted unilateralism lends itself well to the structural reform agenda – allowing economies to focus on those issues they consider to be of vital importance to promoting inclusive growth for their economies. However, issues on which a common set of goals could be established would be those issues on which there was a shared sense of priority: innovation and entrepreneurship; education and labor; infrastructure and regulation.
LABOR AND EDUCATION
As shown in Figure 2.20, structural reforms in education and labor 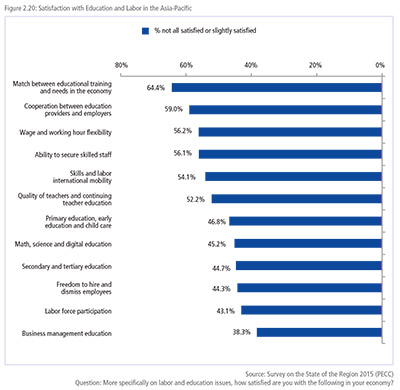 were given high levels of importance. The question is what should policy-makers focus on? Respondents to the survey were least satisfied with: the match between educational training and needs in the economy, followed by cooperation between education providers and employers, wage and working hour flexibility, the ability to secure skilled staff, and skills and labor international mobility.
There was a fairly high level of convergence on views on the top 5 issues on labor and education among sub-regions as well as sectors. As with the broad categories of structural reform, respondents from emerging economies tended to have much lower levels of satisfaction on labor and education issues compared to those from advanced economies. The issues on which levels of satisfaction diverged the most were: math, science and digital education; quality of teachers and continuing teacher education; and secondary and tertiary education.
On math, science, and digital education, the lowest levels of satisfaction were in both Pacific South America and North America with 90 and 64 percent of respondents respectively saying that there were ‘not at all satisfied or slightly satisfied’ with their provision in their economies. This compares to only 22 percent of Northeast Asian’s who were similarly dissatisfied. In general, these findings echo assessments of performance undertaken by the OECD through the Programme for International Student Assessments (PISA) which found on average higher levels of competency in math and science in participating Northeast Asian economies than those from North America. A similar pattern was seen in levels of satisfaction with quality of teachers and continuing education. Conversely, levels of satisfaction with secondary and tertiary education tended to be higher for respondents from North America and Oceania compared to Pacific South America and Southeast Asia.
However, there were a high degrees of convergence in views from both emerging and advanced economies on their levels of dissatisfaction with ‘educational training and the needs and the economy’ and ‘cooperation between education providers and employers’ – in other words there is, at the very least, a perception of a mismatch between the education system and the labor market (see Chapter 1 for a discussion on the importance of labor and education reforms in the region).
SATISFACTION WITH THE PROVISION OF INFRASTRUCTURE
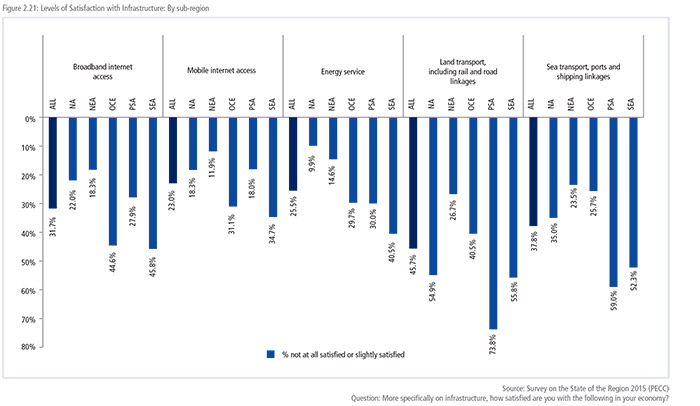
As shown in Figure 2.18 earlier, infrastructure was ranked third highest as a priority for structural reform. To identify priorities, respondents were asked to express their levels of satisfaction with different types of infrastructure in their economy. As with the results on labor and education, there were also sharp differences on the level of satisfaction with different types of infrastructure depending on the sub-region.
Figure 2.21 shows the percentage of respondents by subregion who said that they were ‘not all satisfied or only slightly satisfied’ with the various types of infrastructure. Not shown are views on air transport. Across the region there was a common level of dissatisfaction with land transport including rail and road linkages with the exception of respondents from Oceania who had the highest levels of dissatisfaction with the provisions of broadband internet access. Southeast Asians were least satisfied with land transport followed by sea transport and then broadband internet access.
MAKING PROGRESS ON REGIONAL ECONOMIC INTEGRATION
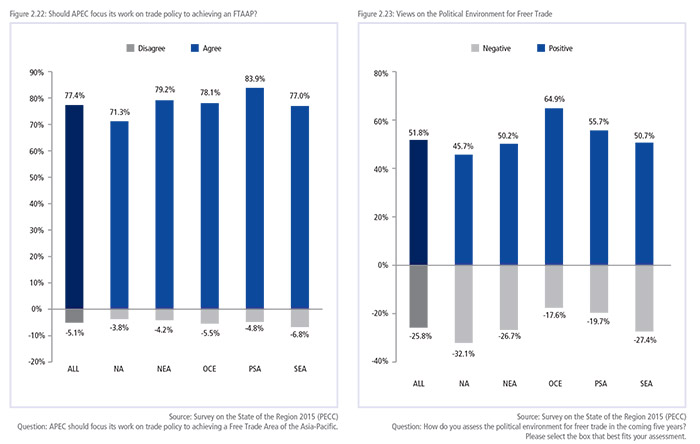
As earlier discussed, a Free Trade Area of the Asia-Pacific has consistently been a top priority for APEC. As shown in Figure 2.22, there was very strong support across all sub-regions for the proposition that APEC should focus its work on trade policy on the achievement of the FTAAP.
However, a key question that has been raised is whether there is the political environment exists for such a large undertaking? As seen in the reaction to the Trans-Pacific Partnership, there are vocal groups who do not believe – rightly or wrongly- that joining such an agreement is in their economy’s best interest. That said, as shown in Figure 2.23, some 52 percent of respondents believe that the political environment for free trade will be positive over the next 5 years, while 26 percent believe it will be negative with the balance neutral on the issue. Importantly, however, the number is much less when looking at North America with 32 percent were negative, much more so that respondents from other sub-regions.
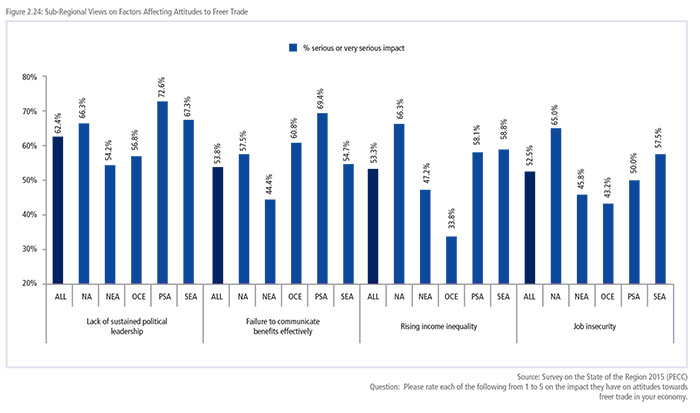
FACTORS AFFECTING ATTITUDES TOWARDS FREER TRADE
To better understand possible reasons behind a lack of support for freer trade respondents were also asked to rate four factors that might influence opinions. As seen in Figure 2.24, the most important factor was a lack of sustained political leadership with 62 percent of respondents rating as a serious or very serious impact on attitudes towards trade.
As shown below, respondents from North America had the most lukewarm assessment of attitudes towards freer trade; this carried into their views on the factors affecting attitudes towards freer trade with their ratings higher across the board for all of the options presented. For North Americans, rising income inequality and job security were seen as influencing opinions towards trade as much as the lack of sustained political leadership.
PERSPECTIVES ON ASIA-PACIFIC REGIONAL COOPERATION
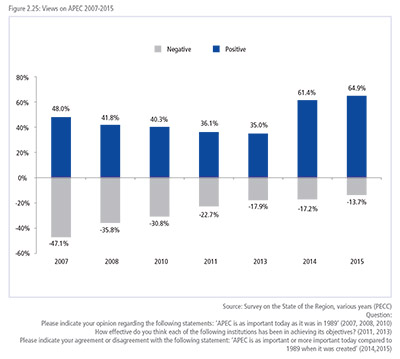
Since PECC began undertaking a survey of the regional policy community, one question that has been asked over the years is on perceptions of APEC’s importance. In 2007, the second annual State of the Region survey, views on APEC were ambivalent with 48 percent having a positive view and 47 percent a negative view. From 2007 to 2013, respondents with a negative perception of APEC dropped from the high of almost half of all respondents to under a fifth at 17 percent. However at the same time, those with positive views also dropped albeit at a slower rate which gave a slightly higher ‘approval’ to APEC but it was less than an outstanding endorsement. In 2014, there was a sharp break in the trend with positive views on APEC jumping to 61 percent and negative views again dropping to 14 percent.
 In the absence of other questions to explain the shift in views it is difficult, if not impossible, to know the reasons for the changing attitudes towards APEC. The shift in views took place in 2014 after Indonesia’s hosting of APEC and in the middle of China’s host year. When attitudes towards APEC were waning some had felt that the reason for a declining view on APEC was the emergence of new architectures for regional and international cooperation such as the East Asia Summit and then the elevation of the G20 to a summit level process. Previous surveys undertaken by PECC did not corroborate that view although the evidence was somewhat equivocal. In the 2010 survey, 40 percent of respondents disagreed when asked if they thought that an expanded East Asia Summit which included the US and Russia was a threat to APEC’s relevance – although a substantial 31 percent did agree. On whether the G20 was a threat to APEC, 60 percent disagreed with the proposition and only 16 percent agreed.
Looking at changing attitudes towards APEC at the sub-regional level provides some detail on where the shifts in perception are taking place. As seen in Figure 2.26 respondents from both North America and Pacific South America had, on balance, a negative perception on the importance of APEC with 63 and 52 percent of respondents from those sub-regions having a negative view and 30 and 46 percent a positive view respectively.
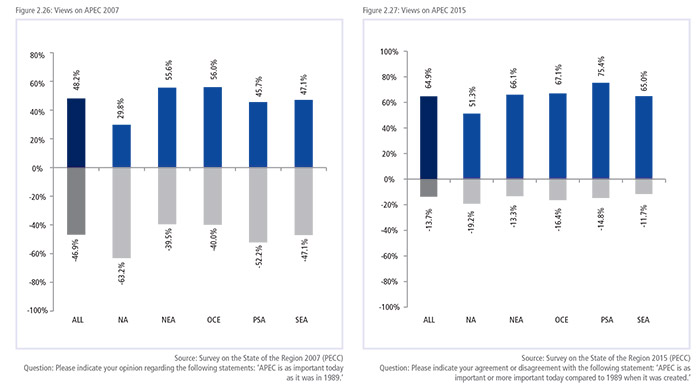
 Over the past eight years, the biggest shift in attitudes towards APEC has been from respondents from Pacific South America with a change of 67 percent closely followed by North Americans at 65 percent. Importantly for the region, there has also been a very positive shift in views from Southeast Asians who were ambivalent towards APEC in 2007 to a 53 percent net positive rating.
Another positive sign on the continued importance of APEC is the interest shown by potential new members. APEC has not admitted a new member since it put in place a 10-year moratorium on membership in 1997. In 2007 that moratorium was extended to 2010 when APEC Leaders stated, ‘Keeping in mind the benefits of APEC membership as well as the need for efficiency to achieve results, we will continue to review the question of APEC new membership going forward.’ In other words, the moratorium is no longer in place but expanding the membership needed to be balanced against the question of efficiency.
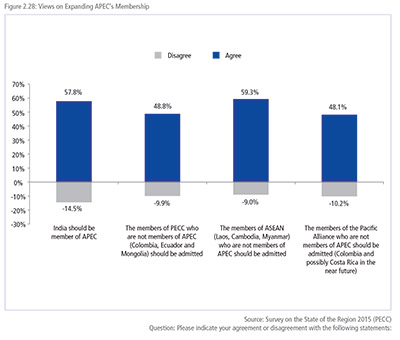
As shown in Figure 2.28, there was the broadest support for admitting the members of ASEAN who had not yet joined APEC – Cambodia, Laos, and Myanmar, then India and then the non- APEC members of PECC and lastly members of the Pacific Alliance. These numbers, however, need to be seen in the right context, when respondents were asked about priorities for APEC Leaders’ discussions, the expansion of APEC membership ranked only 14th with some 18 percent of respondents selecting it as a top 5 priority.
A RENEWED FOCUS ON QUALITY GROWTH
As seen from the results of the survey, there is an urgent need for the region to focus on achieving growth – growth that is not only strong but sustainable and inclusive. APEC’s work since 2010 through the growth strategy, and subsequent years, has helped to give the organization a renewed sense of purpose in the middle of its third decade of existence. At the mid-point in between the deadlines for the achievement of the Bogor Goals for industrialized APEC economies by 2010, and for developing economies by 2020, it is clear that new, innovative approaches are needed to allow economies to effectively reap the benefits of regional economic integration. While there have no doubt been successes, barriers to services in particular – not just cross-border trade in services but barriers to the efficient delivery of services – are a crucial concern. As indicated throughout the survey findings, levels of satisfaction with services in the region are low – whether in electricity, transport, healthcare or education, to mention just a few.
Earlier survey results that indicated a waning of support for APEC have since been replaced by a strong endorsement for its continued relevance in a region where multilateral initiatives have been proliferating. Keeping that relevance will be a challenge as APEC moves on to try to achieve some difficult but critical initiatives. But as argued above, its traditional approach of concerted unilateral cooperation is well-suited to dealing with such issues in a region characterized by diversity. While the results show important differences in views among sub-regions of the Asia-Pacific, they also show some remarkable convergence around key issues affirming the widespread support for the agenda that the APEC process is focusing on.