Chapter 4 - Index of economic integration in the Asia-Pacific
CONTRIBUTED BY DR. BO CHEN
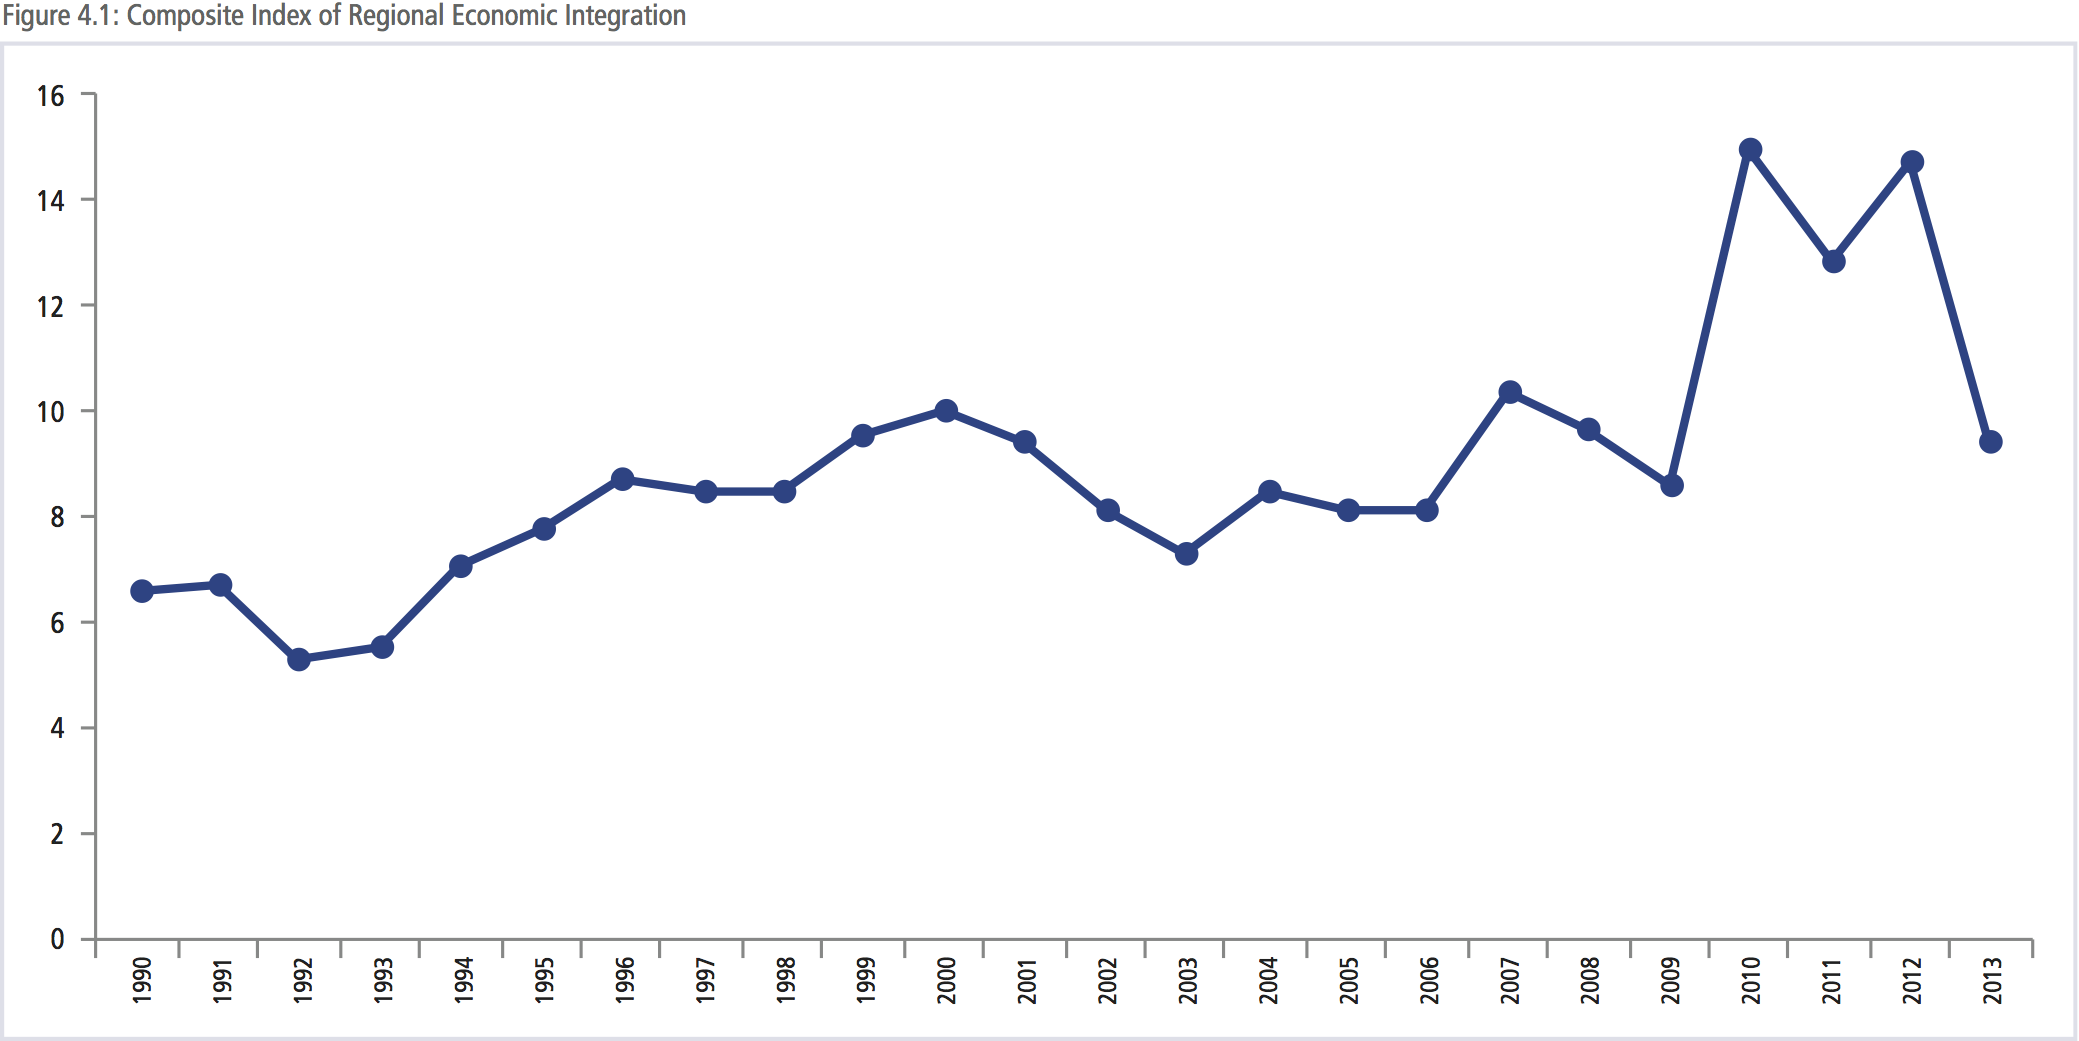
The latest update to PECC’s index of economic integration in the Asia-Pacific region has fallen to its 2009 level. This fall follows the zigzag recovery in the index during the Global Economic Crisis. The index measures the degree of integration taking place in the Asia-Pacific region based on intraregional flows of: goods; investment; tourists; and five measures of convergence: gross domestic product (GDP) per capita; share of non-agriculture to GDP; the urban resident ratio; life expectancy; and share of education expenditure in gross national income (GNI). The index was developed in 2008 as a tool to measure the degree of integration taking place in the Asia-Pacific. Regional economic integration has become a core objective of the Asia-Pacific Economic Cooperation (APEC) forum. The process of economic integration is commonly defined as the freer movement of goods, services, labor, and capital across borders.
The degree of economic integration can be analyzed at bilateral, regional, and global levels. Even though the Asia-Pacific region is not covered by a single trading agreement, there is much anecdotal evidence to suggest that it is becoming more integrated. As defined by the APEC membership, the region consists of not only developed economies such as the US, Japan, Canada, and Australia, but also emerging markets such as the ASEAN economies. It is well known that parts of the region are already highly integrated through production networks that facilitate trade of intermediate and finished goods across borders. Since 1998, many economies in the region have negotiated bilateral and sub-regional free trade agreements with partners in the region as well as outside the region. APEC Leaders have also endorsed a proposal to investigate the idea of a Free Trade Area of the Asia-Pacific (FTAAP), which if successful, would constitute the largest regional trading bloc in the world.
An important feature of the index is that it excludes trade and investment flows among geographically contiguous sub-regional trading partners, namely NAFTA, the ASEAN Free Trade Area, and Australia-New Zealand Closer Economic Relations. It also excludes flows among China, Hong Kong (China), and Chinese Taipei. This is to control for the effect that sub-regional flows may have on the index, whereby a very high degree of integration among, for example, NAFTA economies could result in a falsely high measure of integration with the Asia-Pacific region as a whole.
Furthermore, since trade, investment, and tourism measures are calculated relative to global transactions, the index will rise for a given economy only if that economy’s share of intraregional trade/ investment is growing relative to total trade and investment.
The weights given to each dimension are determined using principal component analysis.
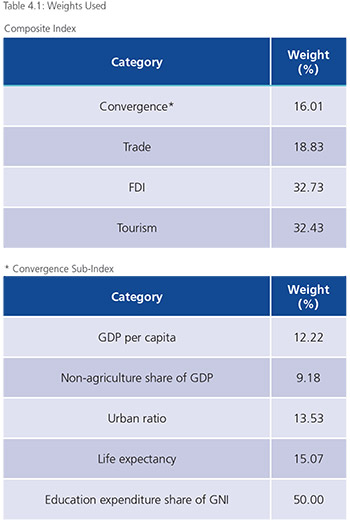
The convergence measures are premised on the notion that integration will lead to greater uniformity among the economies. Accordingly, more trade and investment among regional partners may not translate into a higher score on the integration index if at the same time the partners are diverging in terms of income, education, life expectancy, urbanization, and economic structure.
Caution should be exercised in the interpretation of these findings. The measures chosen for inclusion in the composite index are imperfect indicators of “convergence” and trade/investment integration. The rankings in turn should not be read normatively as “league tables” in the sense that a higher ranking is superior to a lower ranking. A low ranking may simply indicate that an economy is oriented more globally than regionally, as is likely the case for China and the United States.
Nevertheless, the change in index value for a given economy over time can be read as a measure of its changing economic orientation. The index value for the region as a whole can also be seen as a measure of closer economic ties among Asia-Pacific economies and as one indicator of APEC’s success.
The 2016 update to the index is based on the latest data available for the selected dimensions from 2013. Missing data were approximated using standard interpolation and extrapolation techniques.
The most recent figures showed a sharp decline to the index, not seen since 2008-2009. Since the Global Financial Crisis, economic integration in the Asia-Pacific has been volatile. The most recent decline mainly reflects the fact that China’s economy has been slowing down significantly since 2012. However, the convergence indices had a sharp rebound. The 2013 update to indices by economy shows how the overall convergence process has rebounded that year; as a result, 14 out of the 17 Asia-Pacific economies included in this study became more converged to the average mean level of the Asia-Pacific region in 2013.
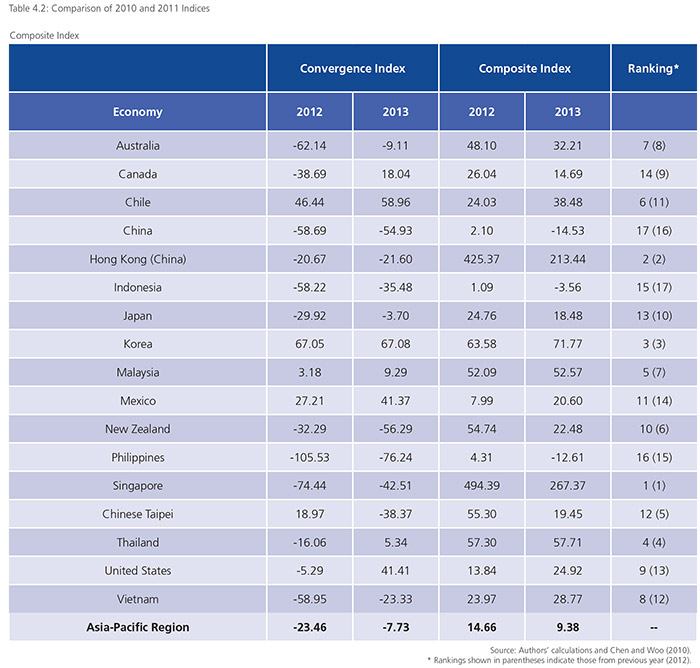
Noticeably, Singapore and Hong Kong (China) are still the most integrated economies with the AP markets. As the freest business harbors, Hong Kong and Singapore benefit the most from economic integration in trade, investment, and tourism. However, both their integration levels declined sharply compared to their 2012 levels. Chinese Taipei has fallen not only in terms of its integration level, but also its relative ranking (from the 5th in 2012 to the 12th in 2013). These figures indicate that these economies are interacting more with those outside the Asia-Pacific region than before.
Likewise, China’s integration index decreased to -14.53 in 2013 from 2.10 in 2012 and has become the least integrated economy in this ranking. Meanwhile, another key economy, the United States, recovered quite quickly from its financial crisis. As a result, it had more interaction with the rest of the Asia-Pacific region, which contributed to substantially increasing its integration index from 13.84 in 2012 to 24.92 in 2013 and its integration ranking also climbed from the 13th to the 9th.
ASIA-PACIFIC TRADE FLOWS
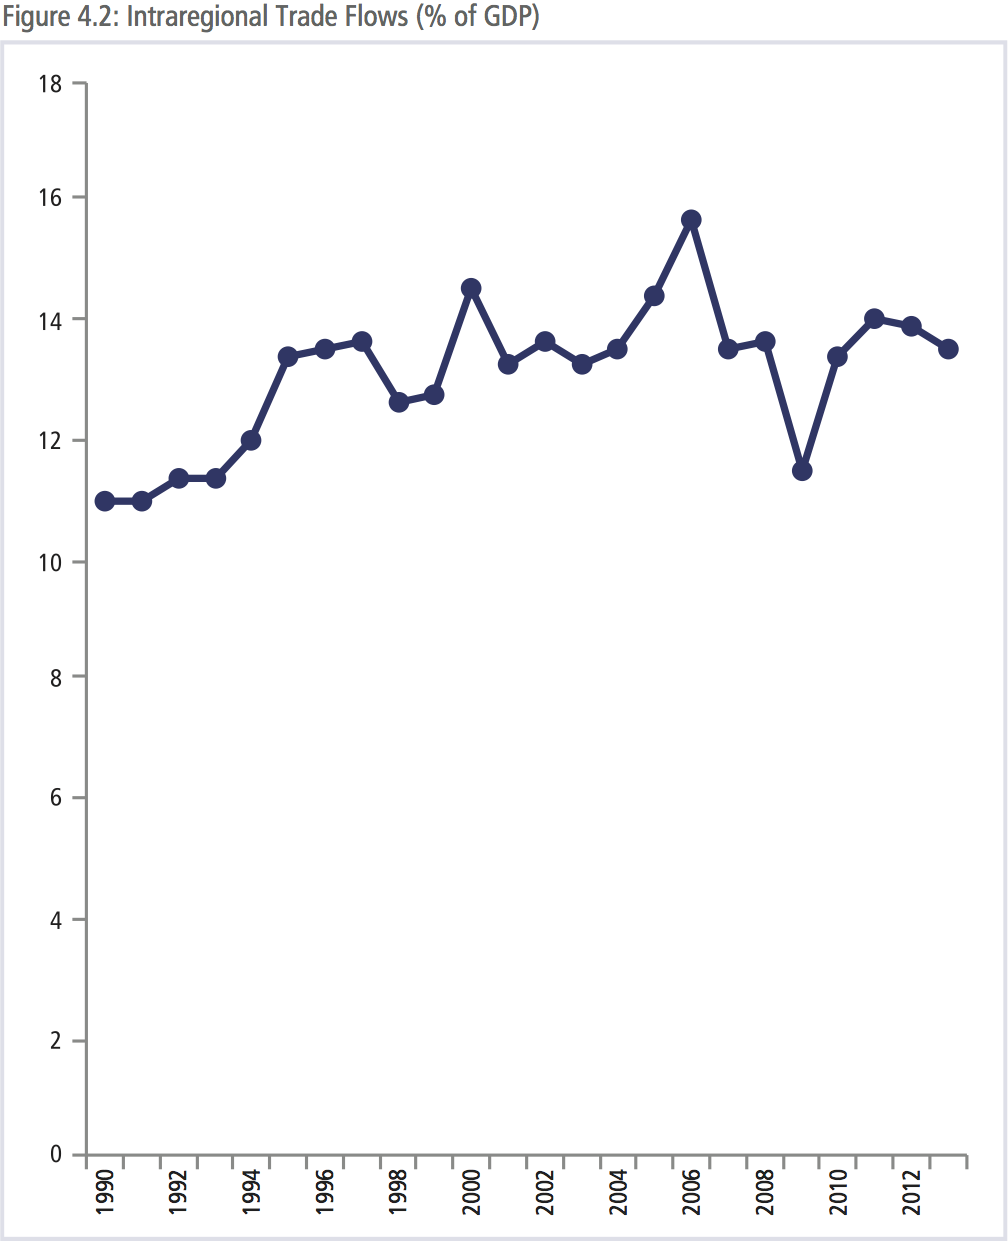
Figure 4.2 shows the share of Asia-Pacific intraregional imports and exports to regional GDP. After various economic stimulus plans, regional economies showed some recovery in terms of intraregional trade flows. Over the twenty-year period, intraregional flows of exports and imports (over GDP) have increased from 14 percent to 15 percent. It should be re-emphasized here that this index discounts flows among sub-regions: the economies of Southeast Asia, North America and those among China, Chinese Taipei and Hong Kong (China).
The share of Asia-Pacific intraregional merchandise trade recovered from the big hit in 2009. However, the recovery was not robust and the recovery trend has been reversed since 2012. Such result is not surprising given China, the world’s largest trading economy and a key player in global supply chain, has been suffering from the pains of economic slowdown and structural change. As a result, only four economies showed slight increases in the Asia-Pacific share of their total trade. They are Vietnam, Canada, Japan, and New Zealand.
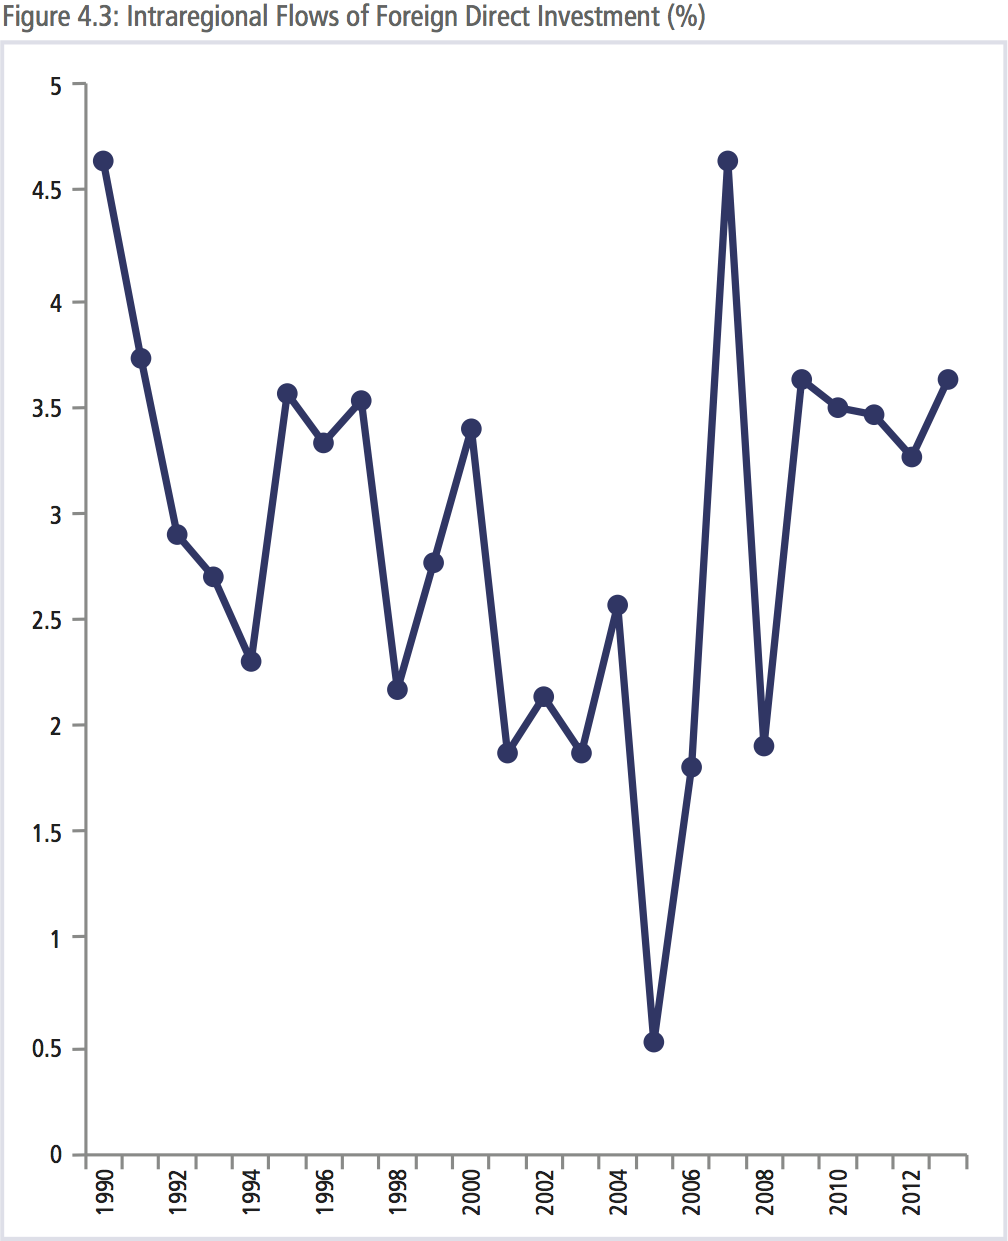
FOREIGN DIRECT INVESTMENT
Compared to flows of goods, intraregional flows of investment show a much more erratic pattern. After the large decrease in foreign direct investment (FDI) flows in 2008, they rebounded by over 200 percent year-on-year between 2008 and 2009, kept the trend till 2011. However, the unstable global and regional economic recovery eventually worried the investors such that the intraregional investment declined by almost 3 percent. Although China’s economy slowed down significantly after 2012, an unusual feature is that its outbound FDI surged due to the economic structural changes and many of traditional businesses started to look for reallocation opportunities in other economies with abundant resource and/or labor supply. Hence, the intraregional investment, unlike the pattern of merchandise goods, substantially increased in 2013.
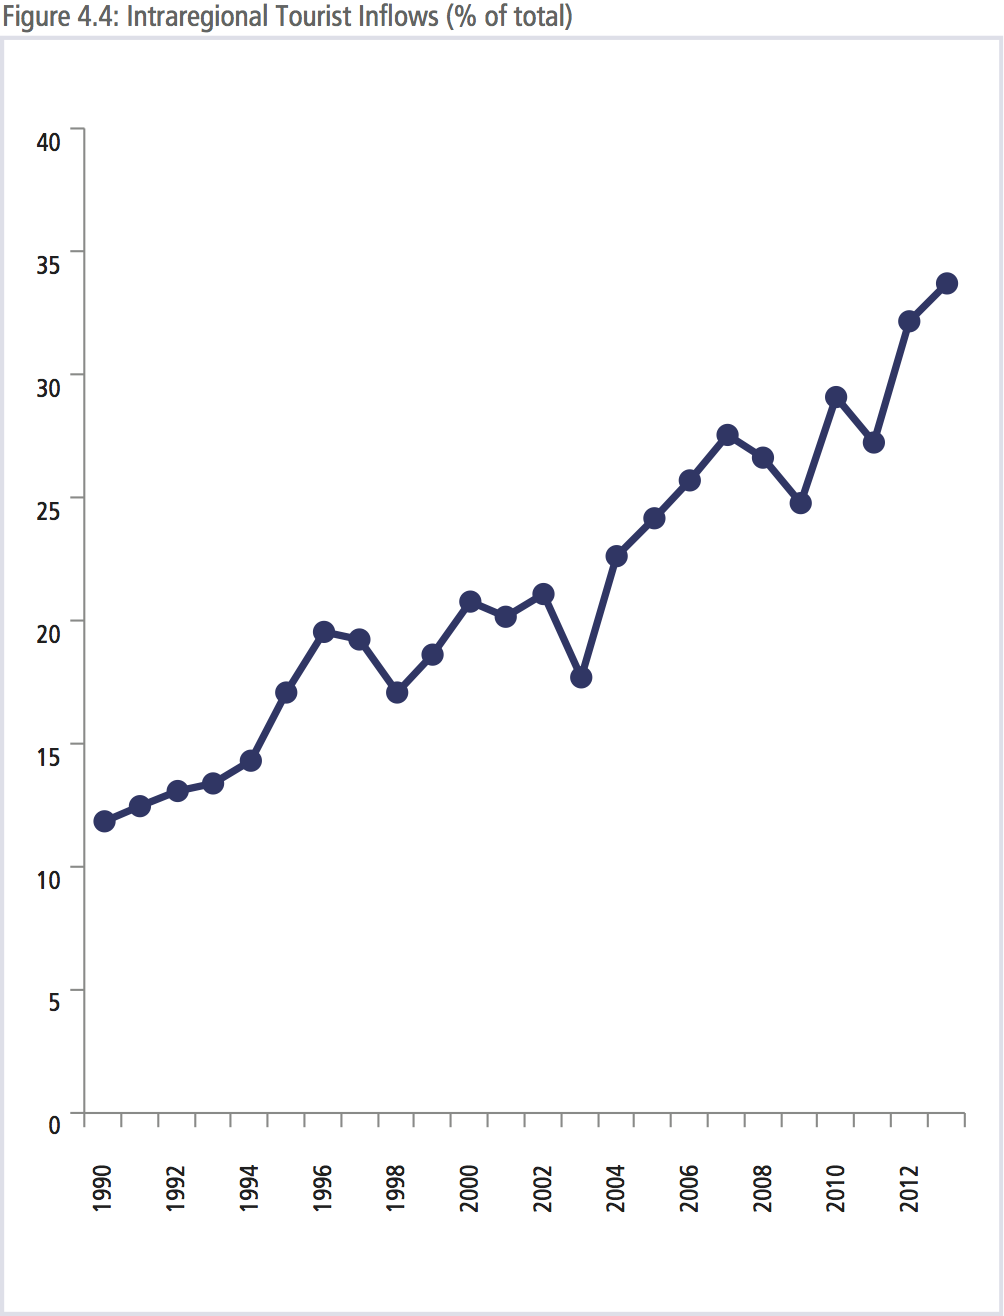
TOURISM FLOWS
Figure 4.4 shows the recovery trend of the intraregional tourism. It indicates that the intraregional tourist share (to every one thousand citizens in hosting economy of the sample) increased further to reach new heights in 2013.
Except for the declines seen in 2007-2009 and 2010-2011, intraregional tourist flows have grown substantially from 18 percent in 2003 to almost 34 percent in 2013, the highest level recorded in our index.
According to the data, while ASEAN nations and China are still the largest recipients of inbound regional tourists, the number for the latter decreased by about 6 percent probably due to its strong currency at that time. Meanwhile, Japan experienced the largest increment of intraregional tourists by more than 25 percent helped by their travel facilitation policies and weak yen.
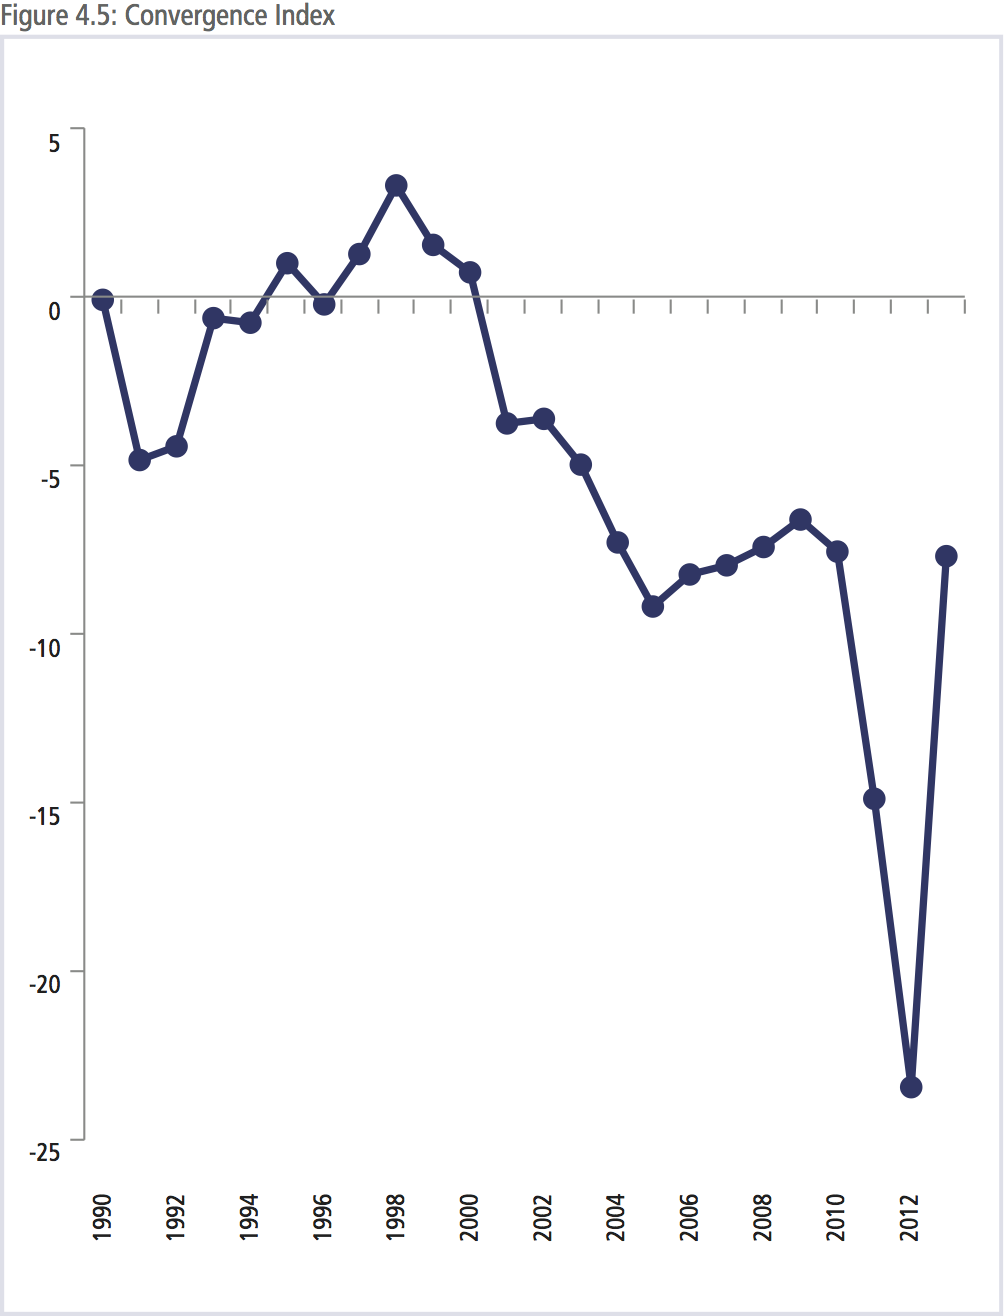
CONVERGENCE INDEX
The sub-index of convergence shows that economies in the region have stopped their divergence trend and redounded to the 2010 level. GDP per capita levels in the region had been converging somewhat during the crisis years. However, in 2010, divergence in incomes began once again and continued into 2012. It should be noted here that GDP per capita accounts for just 12 percent of the weight of this sub-index while education expenditure accounts for 50 percent of the weight. Shifts towards convergence in education, even minor ones, could outweigh much larger shifts in income.
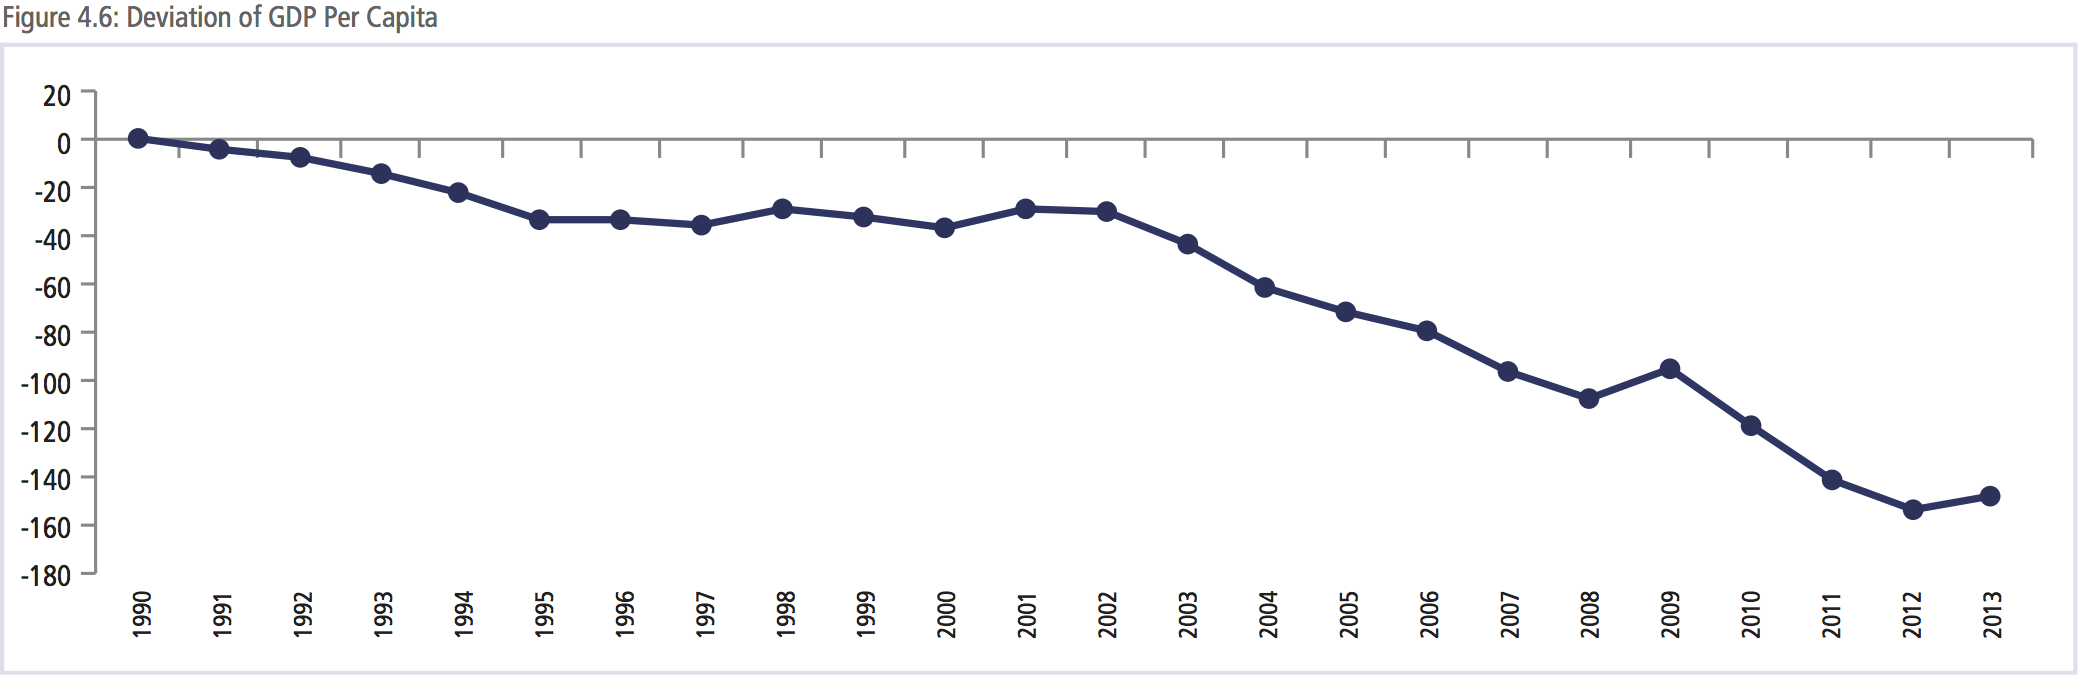
LESS DIVERGING INCOMES
Figure 4.6 shows that the convergence indicator of real GDP per capita decreased in 2009, continuing its sharp decline into 2012. Yet the decreasing trend stopped in 2013 since some of the developed economies such as Japan and Australia had smaller GDP per capita measures by US dollars (which was mainly attributed to their currency depreciation) whereas the figures of some developing economies such as Thailand and Vietnam significantly improved.
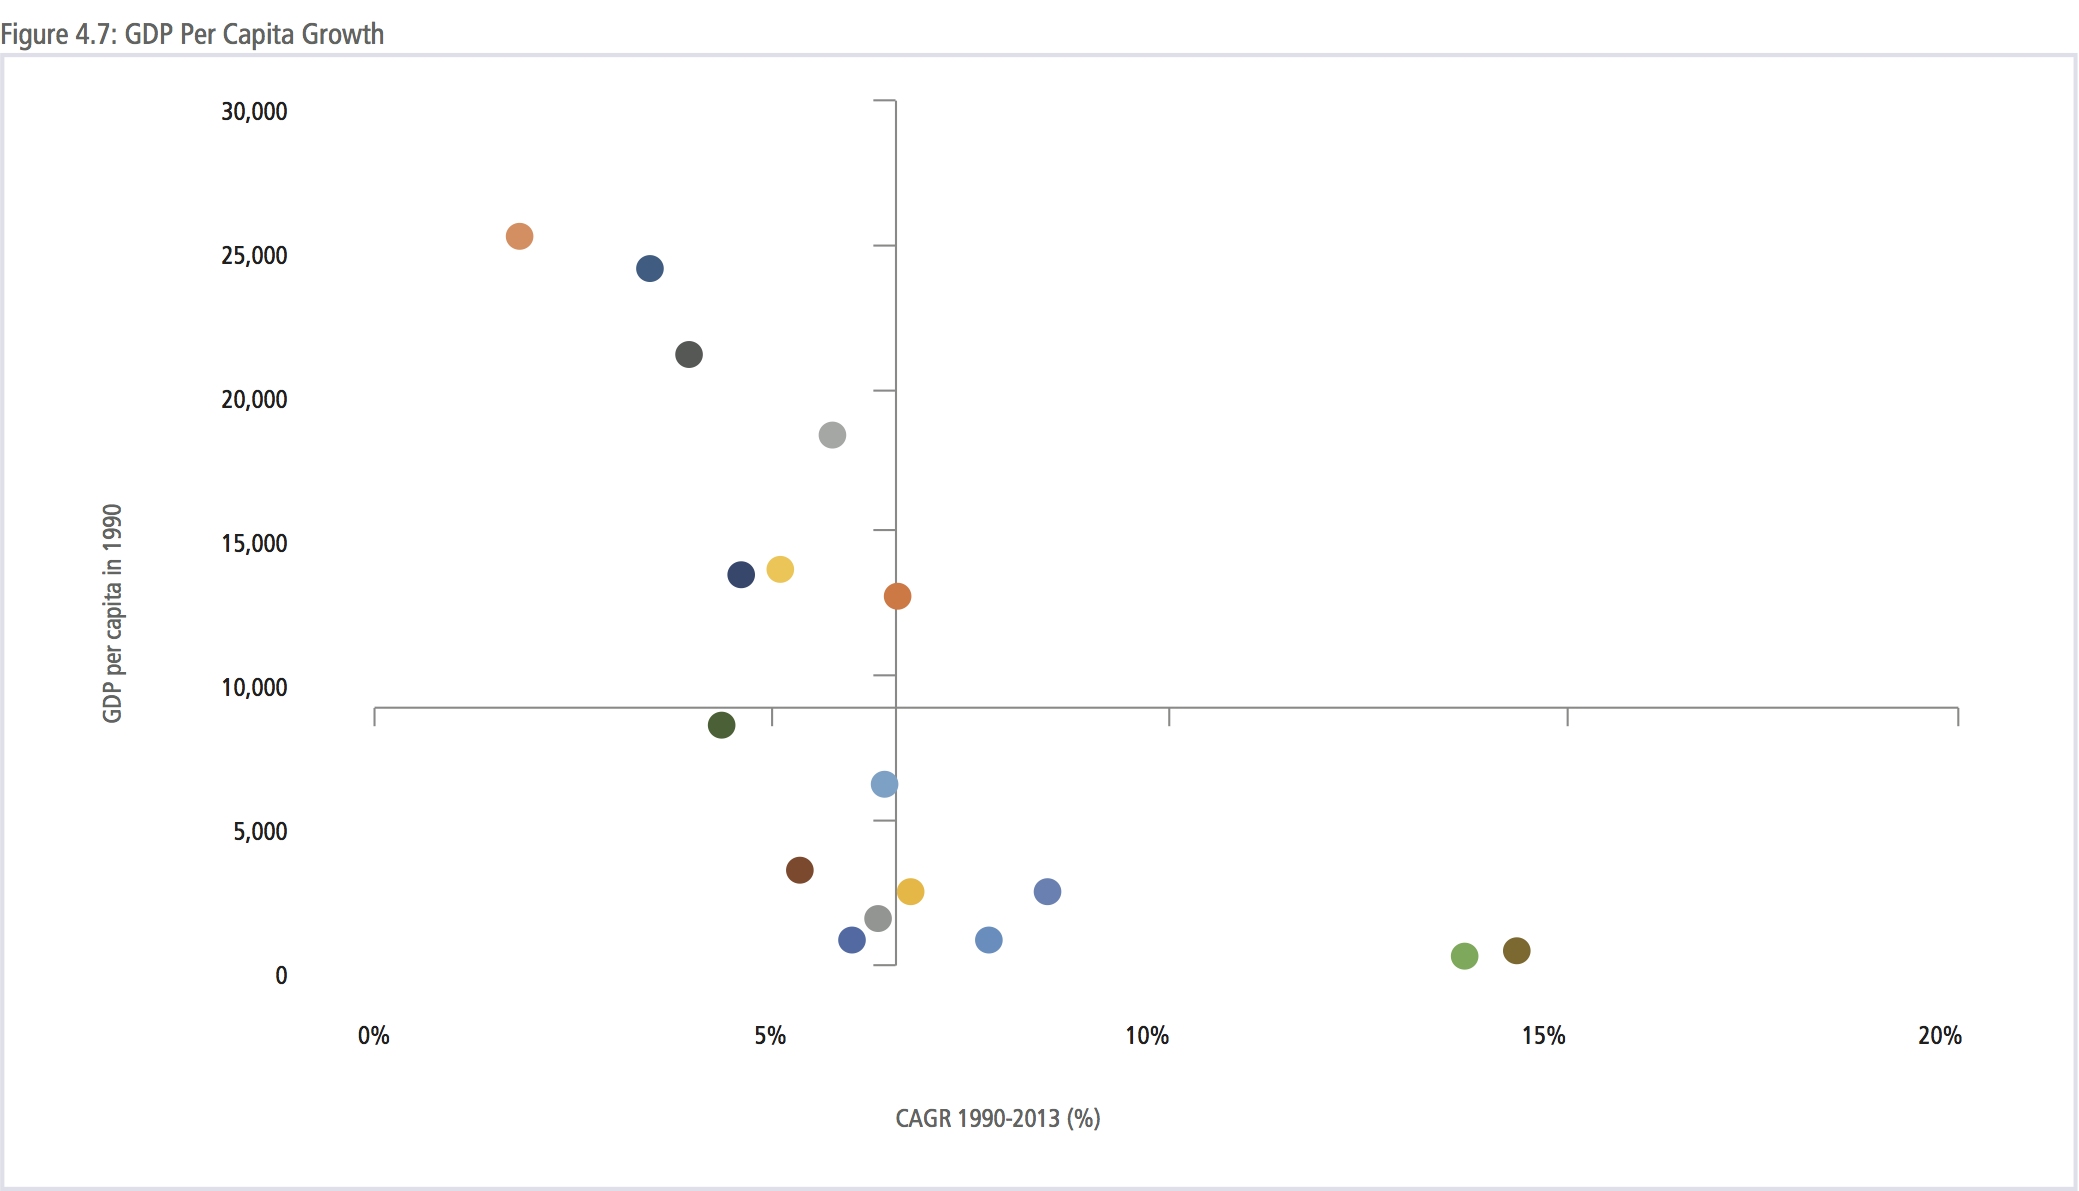
Over the entire index period, the divergence in incomes has been driven by differences in growth rates. In 1990, the average GDP per capita in the region was just below US$10,000. By 2013, it had increased to above US$26,728 or a growth rate of around 5 percent. However, income levels in some economies have grown at a much higher rate than the average in the region while others under the average. For incomes to converge, economies with lower starting GDP per capita levels would need to grow at a much faster rate than those with higher starting levels. Figure 4.7 shows the GDP per capita levels of regional economies in 1990 and the average growth rate over the past 23 years. For incomes to converge, those economies in the bottom left quadrant need to move into the bottom right quadrant.
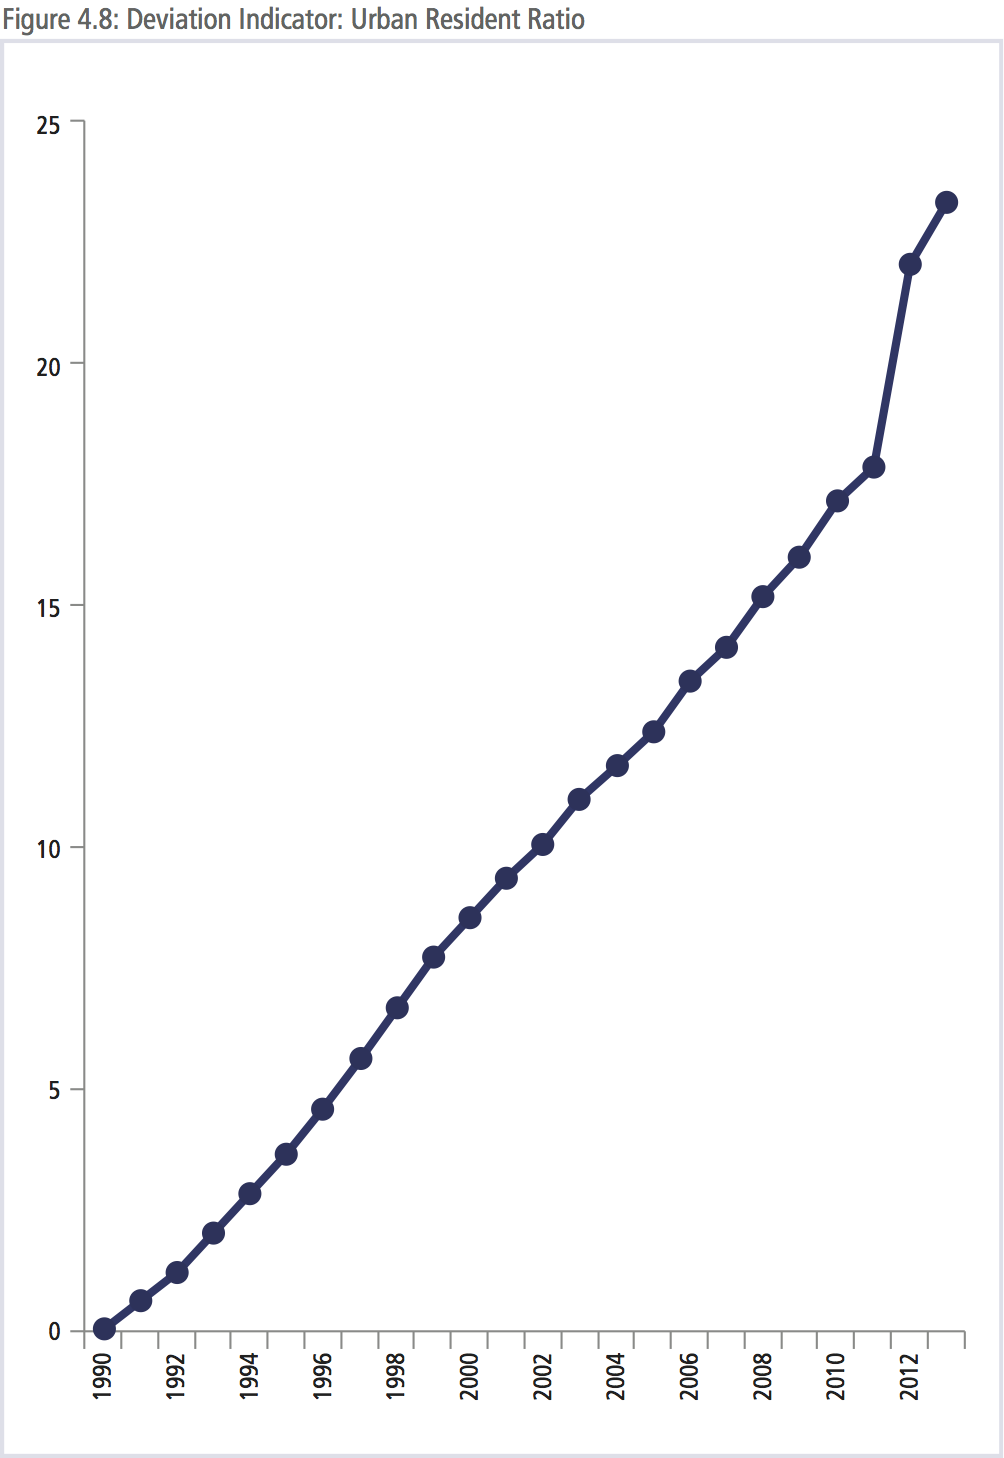
The pace of urbanization in the region has been steady throughout the period as represented by the percentage of population living in urban areas shown in Figure 4.8. In 1990, the urban resident ratio was 89 percent with a standard deviation of 8.2. By 2013, the urban resident ration had increased to 94 percent with a standard deviation of 4.7, meaning that all economies are increasing and they are converging at a similar rate. As seen in Figure 4.8, this has been a very linear trend with few interruptions.
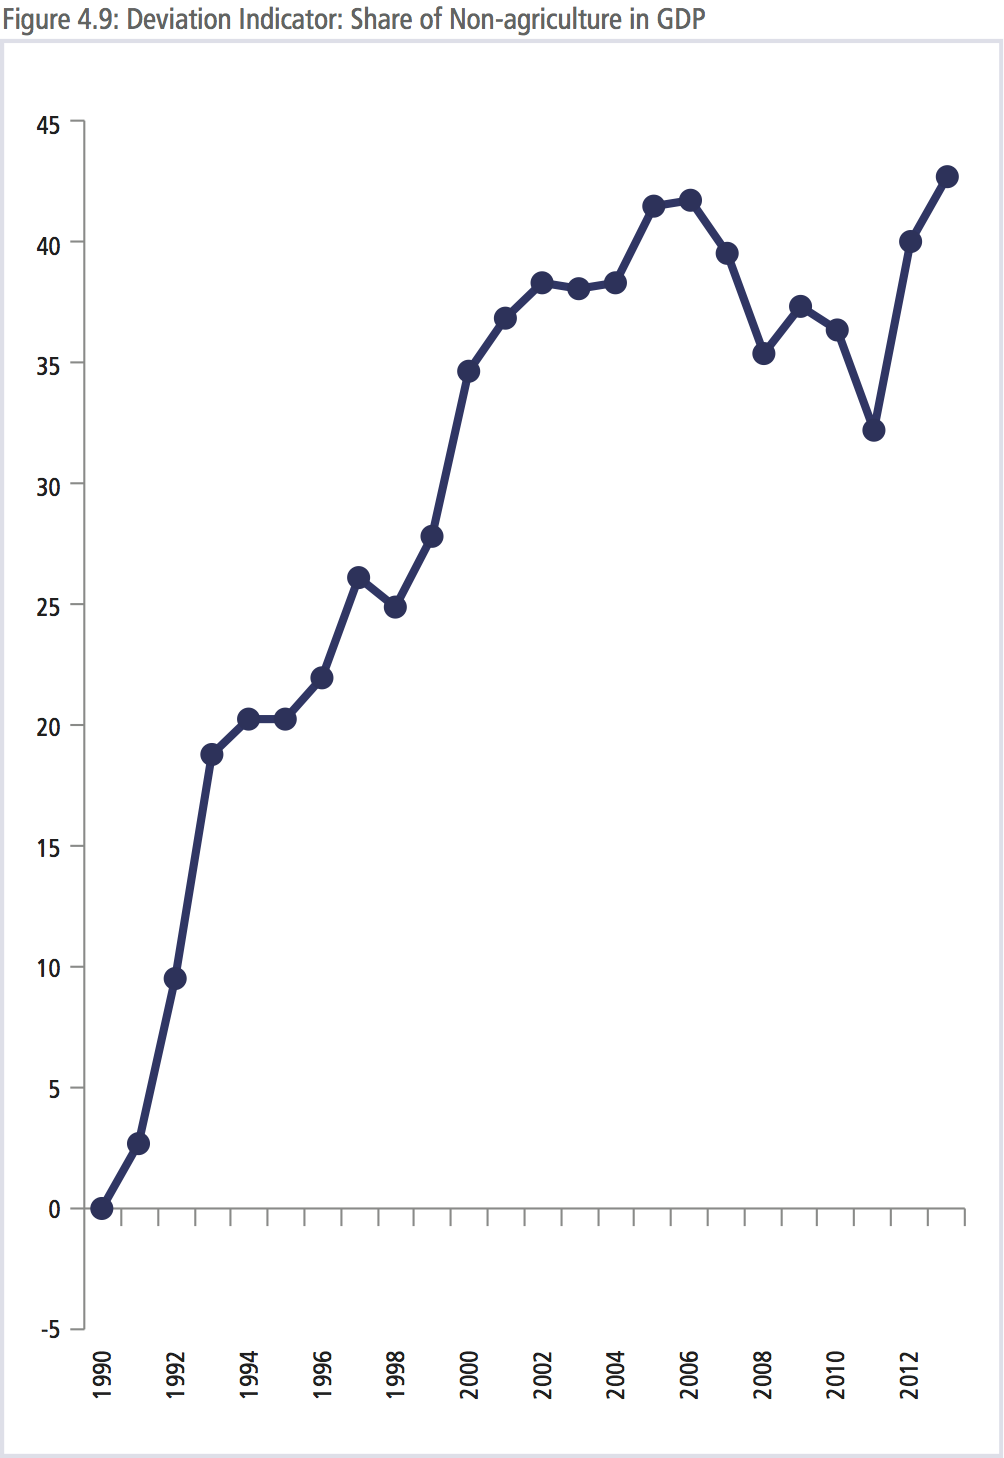
Unlike the convergence pace of urbanization, the share of nonagriculture in GDP had been much more volatile, and started a divergence trend since 2007. However, a strong rebound occurred in 2012 and the convergence level was kept on in 2013. As shown in Figure 4.9, the indicator exceeded the previous peak in 2006. According to the data, the average share of non-agriculture in GDP increased to 94.33 in 2013 from the previous peak of 94.03 in 2006 while the standard deviation across the economies shrunk to 4.71 from 4.78.
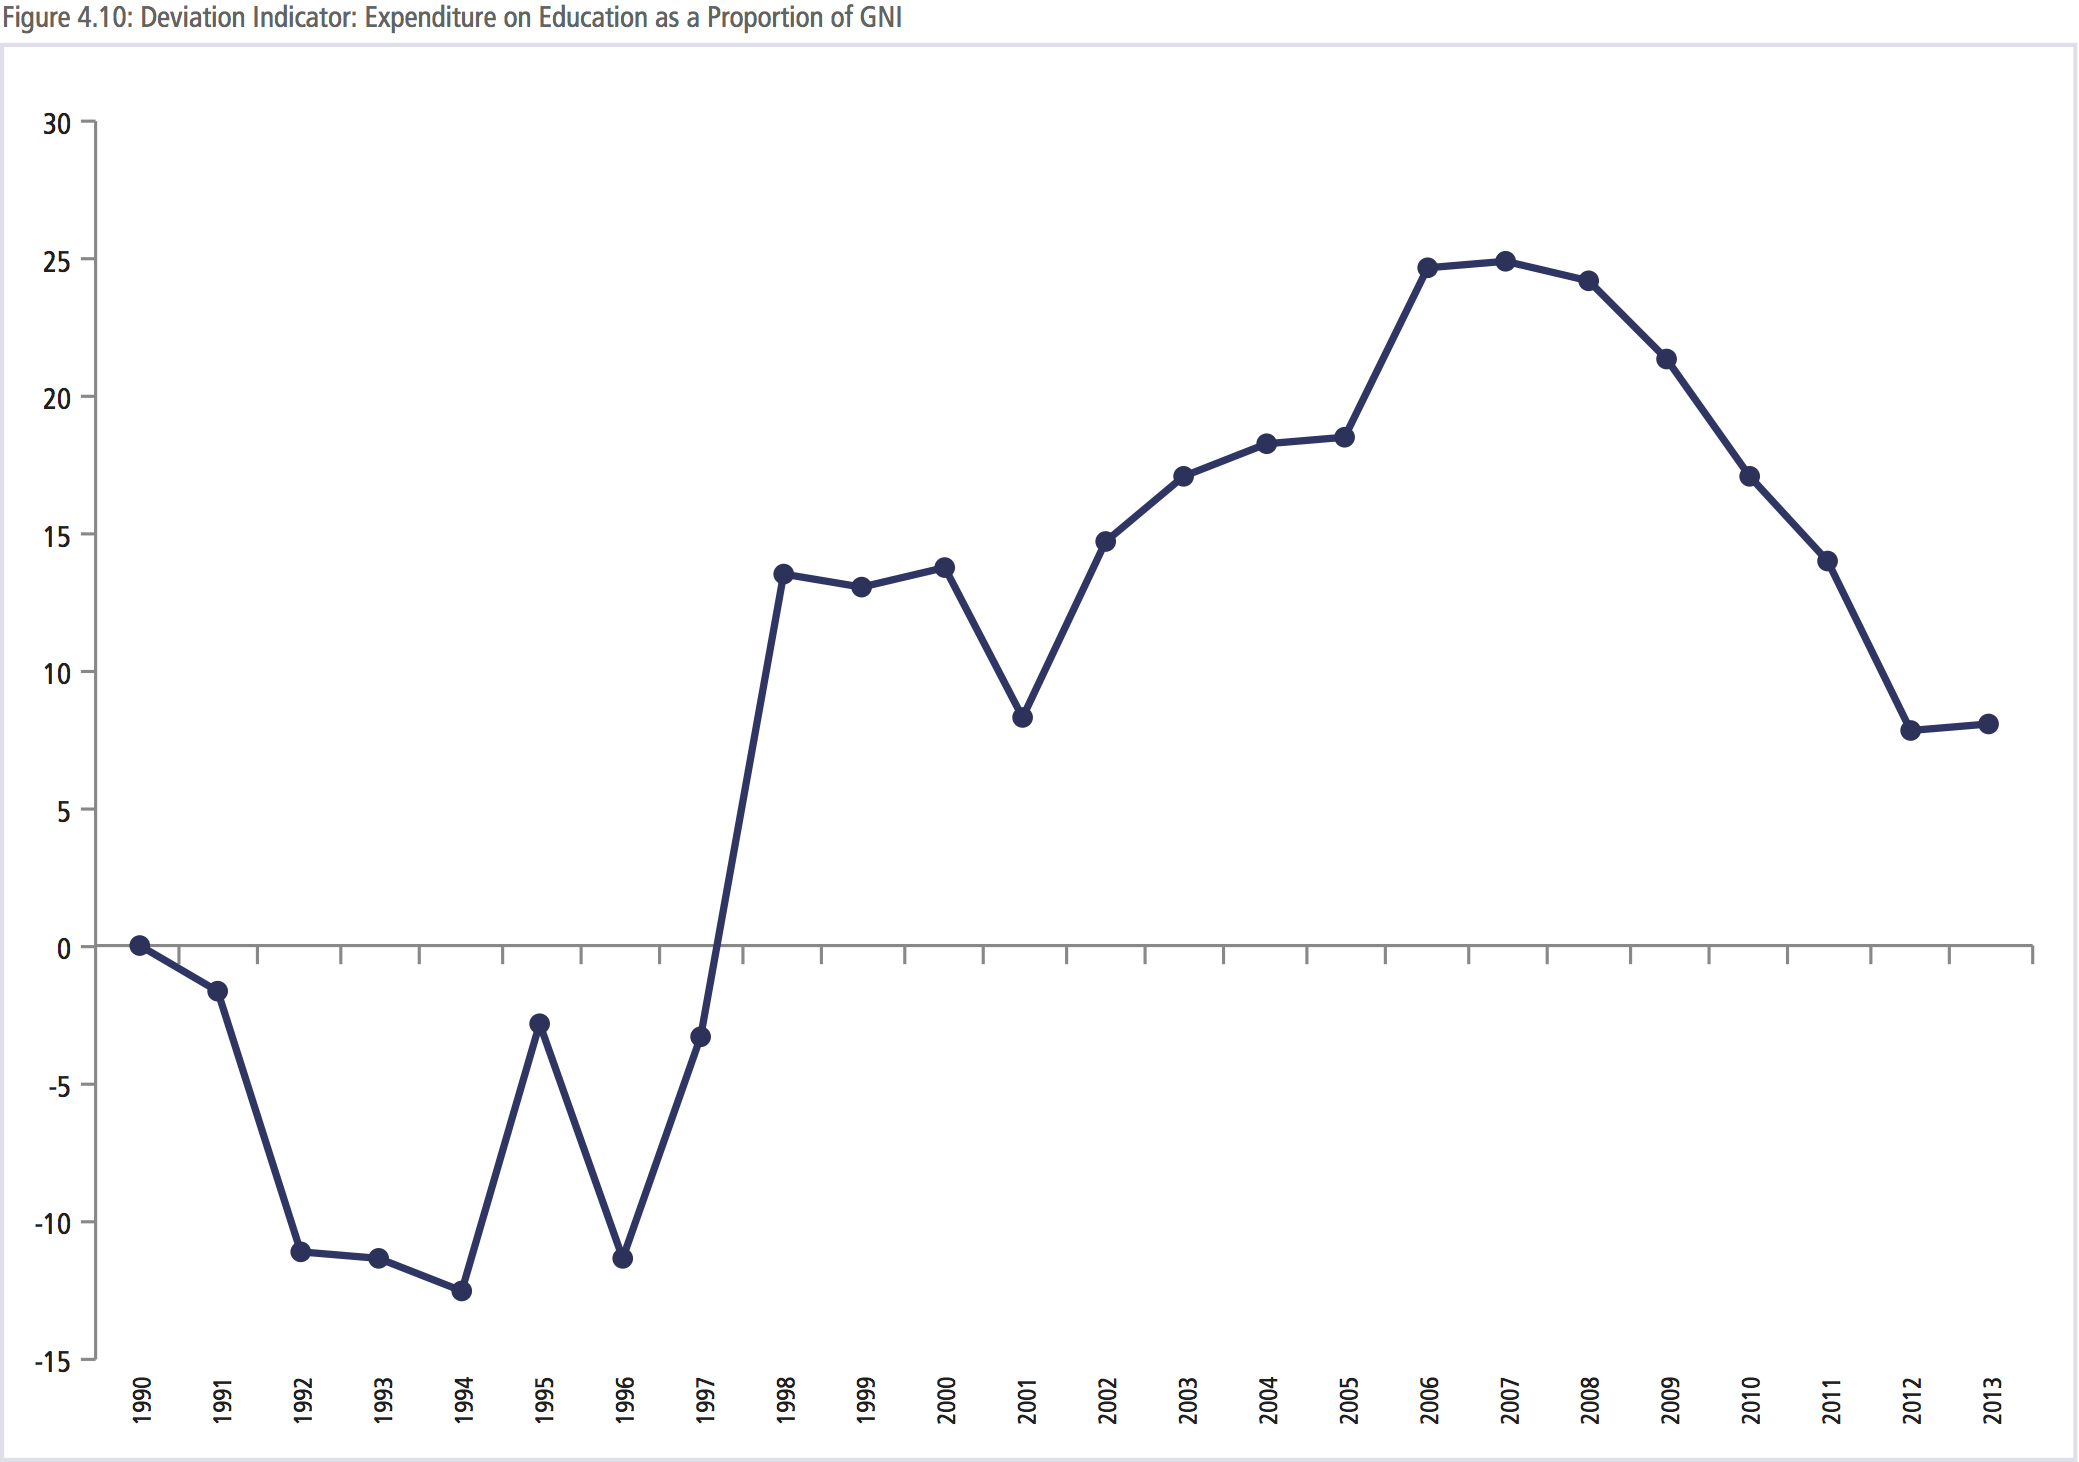
While the proportion of expenditure on education in the region has significantly risen by 2013 compared to 1990, Figure 4.10 shows that its level of convergence has declined since 2008. In 1990, the average expenditure on education as a percentage of gross national income was 3.6 percent; the latest data show that average expenditure was around 4.4 percent of GDP.
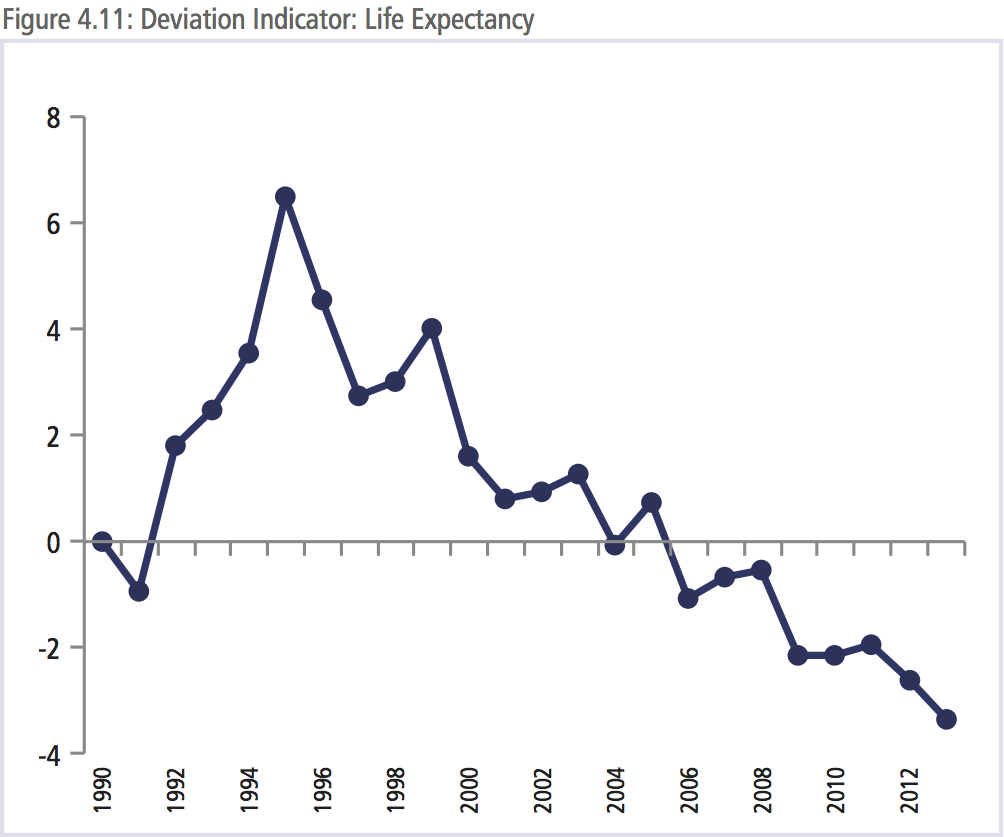
In 1990, the average life expectancy in the region was 72.4 years. By 2013, it had increased by almost 6 years to 78.3, with a standard deviation of 3.6. As seen in Figure 4.11, between 1990 and 1995, life expectancies had been converging. However, the level of convergence began to decrease thereafter. The latest update to the index shows that the level of convergence in life expectancy in the region is even below the level in 1990. This means life expectancy is increasing faster in certain economies than others.
When APEC Leaders set out the Bogor Goals in 1994, they set out a vision through which the region would not only maintain high growth rates but also narrow development gaps. While the region has done well in integrating and overall incomes have increased at a dramatic pace, the index shows that there is a long way to go in terms of closing development gaps. Integration is not an end in itself but a means to ensuring that all citizens can achieve their potentials.