CHAPTER 1 - ASIA-PACIFIC ECONOMIC OUTLOOK
CONTRIBUTED BY MR EDUARDO PEDROSA, SECRETARY GENERAL, PECC INTERNATIONAL SECRETARIAT AND COORDINATOR OF THE STATE OF THE REGION REPORT PROJECT
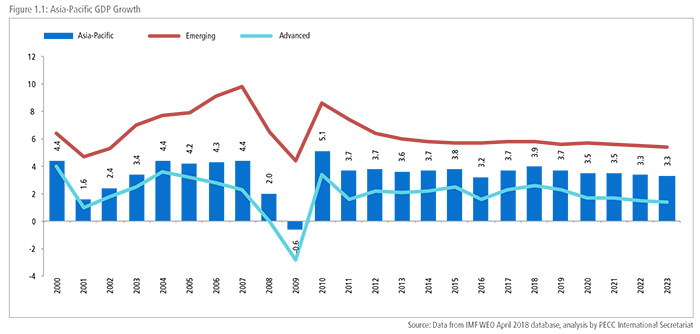
The Asia-Pacific region is expected to grow by 3.9 percent in 2018, its highest level since the 2010 bounce back from Global Financial Crisis. If achieved, this would be a ‘better than expected’ result compared to last year’s forecast which was for 3.6 percent growth. This forecast is based on the IMF’s projections for regional economies that were revised at the beginning of October. This latest revision is 0.1 percent lower than the forecast from April. It is now becoming clear that the headwinds to growth are having a material impact. A regional, if not a global, trade war is putting at risk future economic growth. The revised forecast for 2019 is still for 3.7 percent growth but this is 0.2 percentage points lower than earlier forecasts or a foregone gain of over US$100 billion. The risk from trade conflicts are coupled with those coming from higher commodity prices as well as rising interests with the potential for significant reversals in capital markets.
This comes at a time when the imperative for cooperation is high with all regional economies facing the challenge of having to deal with the impact of technological change. While technologies such as big data, artificial intelligence, 3D printing and robotics can improve peoples’ lives, they are also likely to cause significant CONTRIBUTED BY MR EDUARDO PEDROSA, SECRETARY GENERAL, PECC INTERNATIONAL SECRETARIAT AND COORDINATOR OF THE STATE OF THE REGION REPORT PROJECT disruptions in labor markets that are still feeling the aftershock of the worst economic crisis since the Great Depression.
REGIONAL ECONOMIC OUTLOOK
The uptick in growth in 2018 largely comes from an improvement in growth among the region’s advanced economies, in particular the United States. As a group they are expected to grow by 2.6 percent and 2.3 percent in 2018 and 2019. The prospects for the region’s emerging economies remain steady, with growth of around 5.8 percent this year and 5.6 percent into 2019. All of these numbers have been revised downwards by between 0.1 to 0.2 percentage points.
The biggest increases in growth this year are likely to come from commodity rich economies like Chile, Peru, Colombia and Australia where growth in 2018 is expected to improve by over 0.5 percentage points this year. Looking ahead into 2019, while expecting a moderation in growth for the entire region, growth for commodity rich economies Brunei Darussalam; Mexico; and Colombia will improve by over 0.5 percentage points.
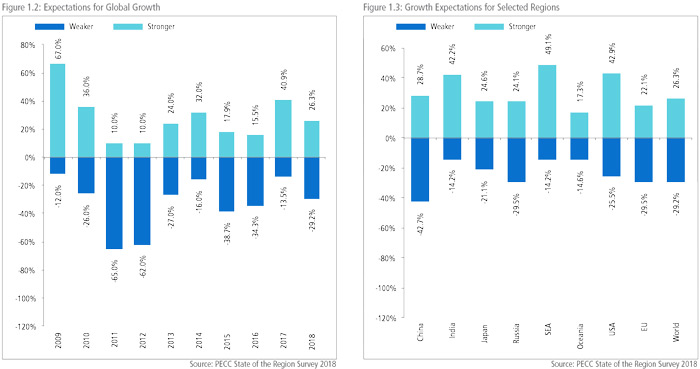
The results of our annual survey of the regional policy community largely echo current economic forecasts with the general expectation that growth will be at around the same level in 2019 as 2018, with 26 percent of respondents expecting stronger growth over the next 12 months compared to 29 percent who expect weaker growth. Over 42 percent of respondents expect growth to be about the same – in line with current forecasts. Of concern, however, is that the buoyancy at this time last year has dissipated.
Respondents to the survey were sanguine about the prospects for growth for specific economies. While still bullish about the prospects for the United States, Southeast Asia and India, pessimists outweighed optimists with respect to growth for China, the EU and Russia.
RISKS TO GROWTH
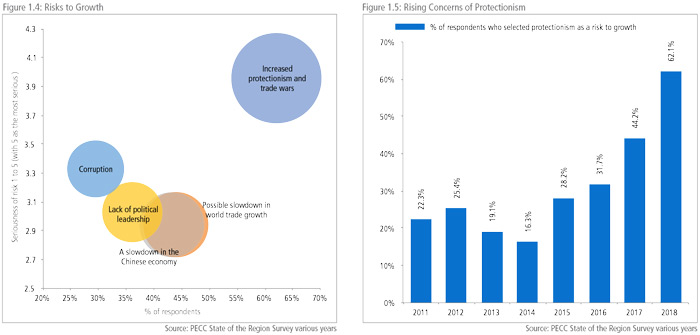
As shown in Figure 1.4, the top 5 risks to growth over the next 2-3 years were:
- Increased protectionism and trade wars
- Possible slowdown in world trade growth
- A slowdown in the Chinese economy
- Lack of political leadership
- Corruption
By far, increased protectionism and trade wars was the most frequently cited risk, with 62 percent of respondents selecting it as a top 5 risk to growth. Surprisingly, the list of risks is largely unchanged from last year, with the exception of corruption which has replaced failure to implement structural reforms as a top risk to growth. What has changed, not surprisingly, given the announcements of tariffs by the United States and retaliations by other economies, is the level of concern over increased protectionism and trade wars.
Figure 1.4 shows the top 5 risks to growth. The chart shows 3 different aspects to this – the percentage of respondents who chose these issues as risks (horizontal axis); the seriousness that those who selected it as a risk (vertical axis); and the overall weighted risk – taking into account both the frequency and magnitude of the risk (size of bubble). While most risks tend to cluster – protectionism stood out in terms of the frequency and impact that respondents thought it would have on the prospects for the growth of their economies.
Over the past 7 years, the percentage of respondents selecting protectionism as a risk to growth has been steadily rising. In last year’s survey 44 percent of respondents selected increased protectionism as the top risk to growth for their economies making it the top risk to growth overall. This year the percentage increased to 62 percent.
TRADE GROWTH FALTERING
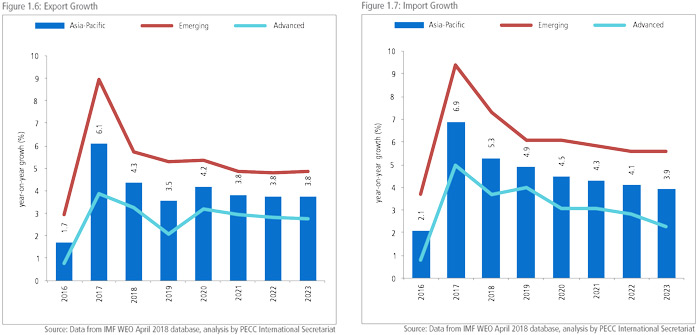
The announcements of increases in tariffs is now having an impact on forecasts for trade. Export growth is expected to drop from last year’s 6.1 percent growth to 4.3 percent this year and to 3.5 percent in 2019.
The slowdown in the region’s export growth this year is unevenly spread, but with economies highly integrated into regional supply chains affected the most. A similar story occurs on the import side, with import growth slowing from 6.9 percent growth in 2017 to 5.3 percent growth this year and 4.9 percent in 2019. Importantly no immediate bounceback is expected within the forecast period.
TRADE RESTRICTIONS NOT LIMITED TO TARIFFS
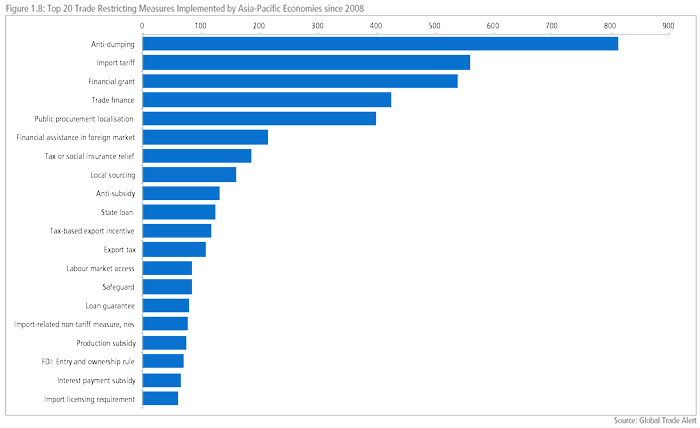
As shown in Figure 1.5 concerns over protectionism have been on the rise over the past few years. While much attention has been focused on more recent announcements, particularly by the United States and China’s reactions to them, Figure 1.8 shows that import tariffs have not been the most frequently used trade restricting measure since 2008. It is clear that regional economies have been implementing what was described as ‘creeping protectionism’ for years, despite well-intentioned high-level political statements eschewing the use of all protectionist measures.
While there is some debate on whether recent events can be described as a trade war – as shown below, the issues go well beyond tariffs.
FORWARD MOMENTUM ON TRADE REMAINS (DESPITE APPEARANCES TO CONTRARY)
While it is clear that trade restricting measures have been on the rise, at the same time economies have also been undertaking liberalizing measures either unilaterally or in trade deals. This includes the conclusion of the Comprehensive and Progressive Agreement on TransPacific Partnership (CPTPP) and the ongoing negotiations on the Regional Comprehensive Economic Partnership (RCEP).
The entry into force of the CPTPP and the conclusion of the RCEP would provide a critical amount of policy certainty that would encourage businesses to invest in these markets. For the CPTPP to enter into force, 6 of the 11 signatories need to ratify it. To date,Mexico, Japan and Singapore have already ratified the agreement, leaving just 3 more until it enters into force. Perhaps of greater significance is that several others have signaled their desire to join including Indonesia, Korea, Chinese Taipei and Thailand. Even though President Trump withdrew the United States from the original TPP, he has also indicated a willingness to join an improved agreement.1 In addition to APEC members, Colombia, the only Pacific Alliance member not a party to the CPTPP, has indicated its desire to join and the United Kingdom – a long way from the Pacific – has also begun consultations on joining the CPTPP as part of its potential post-Brexit strategy.
The RCEP would create the world’s single largest trade zone comprising over 3 billion people. If achieved, the importance of the RCEP would grow over time as its members become increasingly middle-class and consumption increases. Indeed, that forward momentum is an additional contributing factor in the continued robustness in trade growth in spite of ongoing trade disputes. While the baseline forecasts for trade growth remain positive, the trade conflict adds another variable to an extremely complex but still positive macroeconomic and financial backdrop.
In addition to the CPTPP and RCEP, regional economies have continued to conclude deals both with regional partners and beyond. For example, Canada has concluded its negotiations with the EU and is seeking to begin negotiations with ASEAN. The Pacific Alliance is now negotiating as a group with associate members Australia, Canada, New Zealand, and Singapore.
While new trade deals continue to be negotiated, older trade deals are also being changed. One of the oldest in the region, the North American Free Trade Agreement (NAFTA) has been updated and renamed to reflect changes and will be known as the USMexico- Canada Agreement (USMCA) which was concluded on 30 September 2018.3 Reports suggest that the USMCA will differ from NAFTA in several key provisions, including higher requirements for regional value-add, changes in the dispute settlement process, as well as a clause on negotiating an agreement with non-market economies.
TROUBLING SIGNS IN CAPITAL MARKETS
While forecasts for trade growth remain positive albeit at a slower pace, capital markets have demonstrated increasing volatility and bearishness.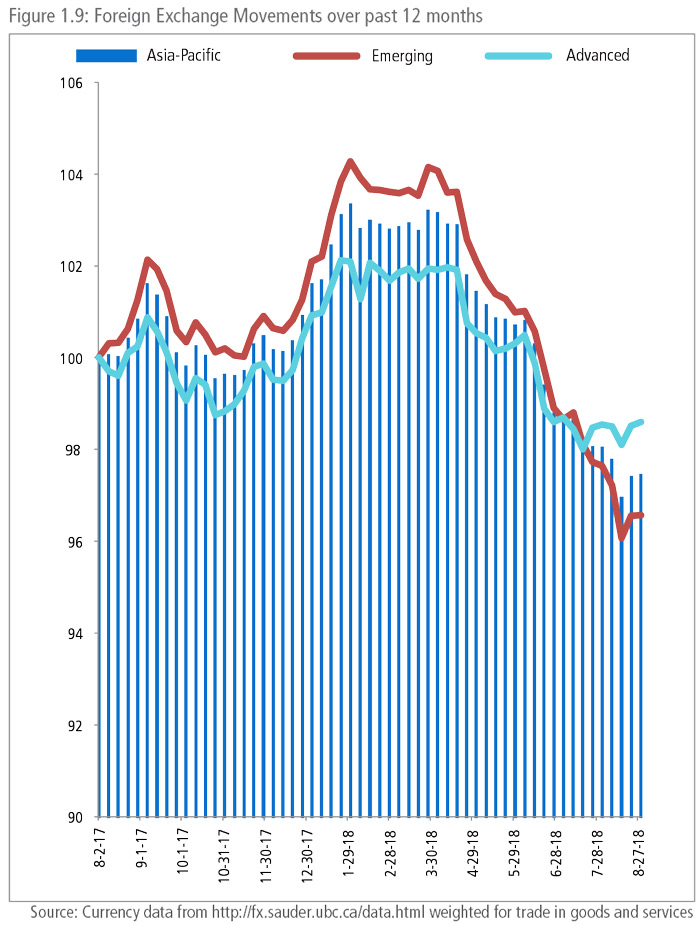 Since August 2017, regional currencies have lost, on average, around 2.6 percent of value against the US dollar. However, emerging market currencies have depreciated considerably more than advanced economies. On average, Asia- Pacific emerging economies currencies have lost 3.4 percent of value against the US$ compared to 1.4 percent for advanced economies (see Figure 1.9). The flipside of this is the strengthening of the US dollar, reflecting rising US interest rates, and its impact on its export competitiveness. Given the current environment this trend may further exacerbate trade tensions.
The averages belie more significant movements for individual currencies, some of whom have lost as much as 10 percent in value against the US dollar. Part of this may be due to more general worsening sentiments towards emerging markets due to situations elsewhere – particularly debt crises in Argentina and Turkey. For example, Indonesia’s Finance Minister and former Managing Director of the World Bank, Sri Mulyani said that, “we are monitoring global dynamics and need to be vigilant because the dynamics caused by the sentiment on Argentina is very high. The situation there is not yet finished, so we’re anticipating these dynamics will continue.” 5 Since the end of August 2017, emerging market equities have been struggling. The Morgan Stanley Emerging Market Fund, for example, has lost around 9 percent of value in spite of the strong macroeconomic performance in most emerging markets. The IMF’s October Outlook notes that “after a buoyant start to the year, capital flows to emerging markets weakened considerably in the second quarter and beyond … nonresident portfolio flows, which were strong during 2017 and early 2018, turned negative in May– June of 2018, consistent with foreign exchange market pressures on several emerging market economies.”
 The weakening of regional currencies against the US dollar has precipitated actions by central banks. For example, on 24 August the People’s Bank of China announced that it was introducing a “counter-cyclical factor” to mitigate pro-cyclical market behavior and stabilize market expectations.
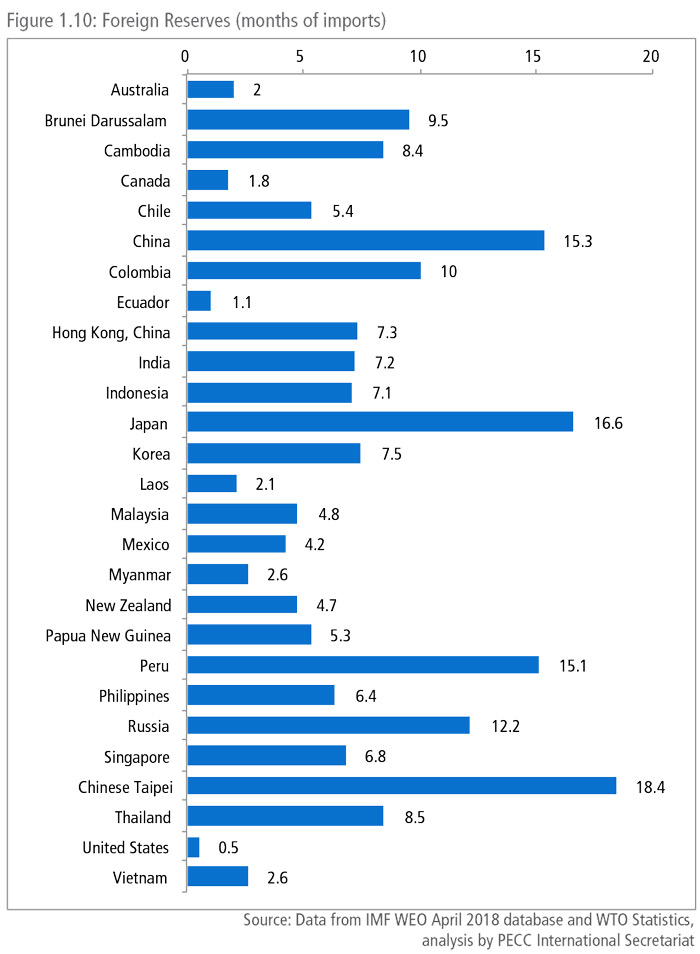
As shown in Figure 1.10, against traditional benchmarks most regional economies have more than adequate reserves (traditionally 3 months of imports), however the IMF warns that traditional measures of reserve adequacy have limited relevance, ‘the reserve losses that many economies experienced during crises did not show any relationship with needs. This reflects the fact that each crisis is unique and that the impact of crises vary greatly, resulting from withdrawal of foreign capital, while others involve the loss of export income, or capital flight by domestic residents.’
Part of the complexity and potential for swift reversal is the massive injections of liquidity into the financial system. This has supported very high debt levels. According to estimates by the Institute of International Finance, global debt levels now stand at around US$247 trillion. Of this, 75 percent was household, nonfinancial corporate and general government debt and 25 percent in the financial sector.9 At the end of 2007, Asia-Pacific economies had around US$13 trillion in short and long-term debt as equity and investment fund shares. At the end of 2017, this had risen to US$22 trillion or 46 percent of the region’s GDP (as measured at current prices) an increase of 5.6 percent over the last decade. There are, however, considerable differences within the region. In regional emerging economies this has dropped by 3.1 percent over the same period while it has increased for the region’s advanced economies by 17 percent.
Given this situation, it is somewhat surprising that only 18 percent of respondents to PECC’s survey selected unsustainable debt as a risk to growth, a similar percentage to those who selected unfavorable currency alignments. Even fewer, 14 percent of respondents, selected a sharp fall in asset prices as a risk to growth. While that result may indicate that these are not immediate concerns, they might also show complacency or an inability to price risk. In his speech at the August 2018 Jackson Hole Symposium, the General Manager of the Bank of International Settlements warned that “Retreating into protectionism also risks unravelling the financial interdependencies that enable and encourage trade and investment links. This threatens to unsettle financial markets and put a drag on firms’ capital spending, as investors take fright and financial conditions tighten. Finally, these real and financial risks could amplify each other, creating a perfect storm and exacting an even higher price.”
PRIORITIES FOR APEC LEADERS’ DISCUSSIONS
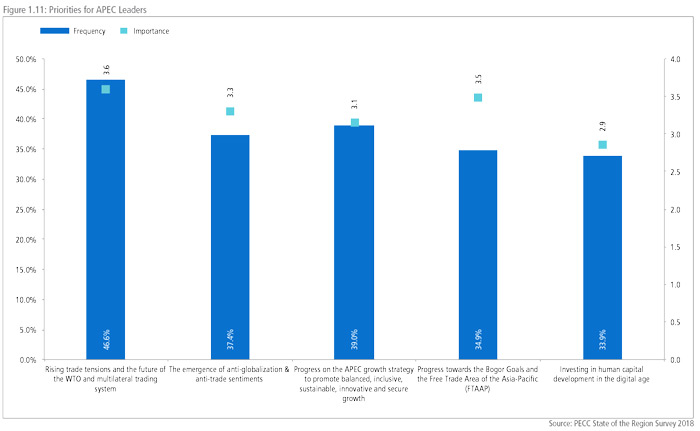
As shown in Figure 1.11, regional stakeholders identified the following issues as the top 5 priorities for APEC leaders’ discussions:
- Rising trade tensions and the future of the WTO and multilateral trading system
- The emergence of anti-globalization & anti-trade sentiments
- Progress on the APEC growth strategy to promote balanced, inclusive, sustainable, innovative and secure growth
- Progress towards the Bogor Goals and the Free Trade Area of the Asia-Pacific (FTAAP)
- Investing in human capital development in the digital age
This represents a remarkable turnaround of views regarding attitudes toward the WTO and the multilateral trading system. 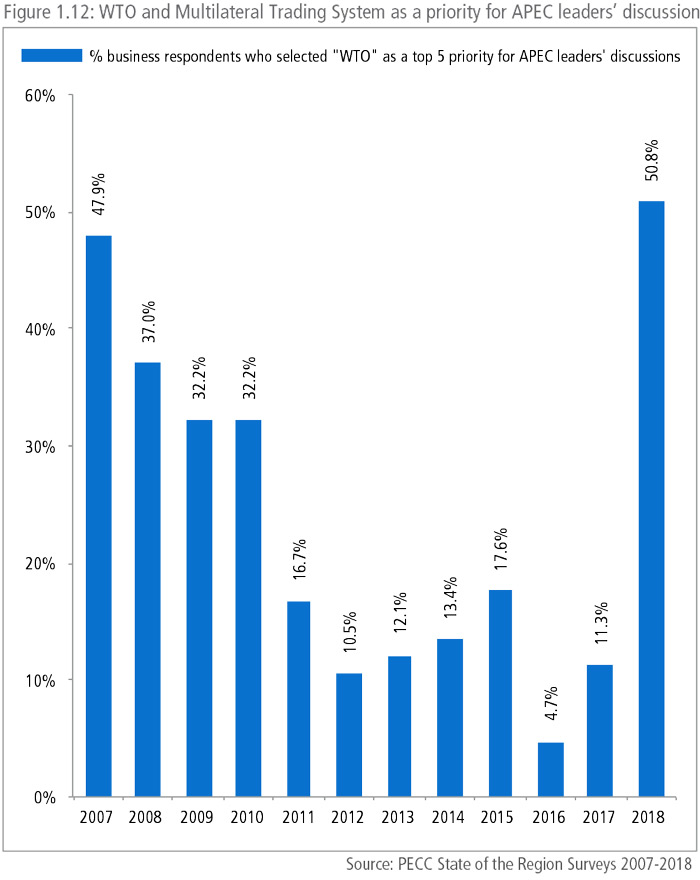 Figure 1.12 shows the percentage of business respondents who selected a WTO issue as a priority for APEC leaders’ discussions since 2007.10 When PECC began its survey of regional stakeholders in 2007, 48 percent selected “The WTO Doha Development Round” as a top 5 priority for Leaders, but over time, any option that mentioned the WTO declined in importance. In last year’s survey, only 11 percent thought that “Building political support on key issues for the WTO Ministerial” should be a priority. As the survey results demonstrate, over time the Asia-Pacific policy community had become much more focused on regional trade deals and the growth strategy. However, recent events have clearly had an impact on views. Moreover, it is more than likely that stakeholders, at least those surveyed by PECC, equated the value of the WTO with its negotiating function and took for granted the existence of the rules, disciplines, and dispute resolution mechanisms associated with the institution.
The future of the WTO and the multilateral trading system is discussed in more detail below. A critical part of the regional narrative in recent years has been how to best address the emergence of anti-globalization and anti-trade sentiments. A core element of this had been efforts to promote growth that is more equitable or inclusive.
PROGRESS TOWARDS THE BOGOR GOALS AND THE FREE TRADE AREA OF THE ASIAPACIFIC (FTAAP)
The Bogor Goals have helped to drive APEC work since they were first adopted in 1994. With the deadline for the achievement of ‘free and open trade in the Asia-Pacific by 2020’ fast approaching, efforts are underway to consider what the future vision for APEC should be. The survey results reveal strong support for APEC focusing its trade policy work on achieving an FTAAP with 77 percent agreeing and only 4 percent disagreeing. This is in spite of an overall negative assessment of the political environment for freer trade in the Asia-Pacific. This underscores the importance of seeing the FTAAP as a long-term goal that will require substantial activities, preferably led by APEC, to ensure that all regional economies can effectively participate in and benefit from deeper regional economic integration.
Another dimension to this discussion is whether APEC’s work is overly focused on trade policy. Over 56 percent of respondents to PECC’s annual survey agreed with the proposition that ‘APEC should put less emphasis on free trade and more on broad economic growth, infrastructure, and jobs.’ (See discussion below on the Need for a Broader Approach to Economic Integration?) While that is less than the total percentage of respondents who thought that APEC should focus its trade work on FTAAP, the two statements are not mutually exclusive. Indeed, many argue that the idea of the Bogor Goals and the FTAAP is not that they are ends in themselves but simply the best, most effective means to the broader aim of a more prosperous and equitable region
RISING TRADE TENSIONS AND THE FUTURE OF THE WTO AND MULTILATERAL TRADING SYSTEM
While stakeholders may now be sufficiently concerned to put the WTO as a priority, the critical question is what role can regional institutions play? In its report to APEC leaders in 2017, business stakeholders as represented by the APEC Business Advisory Council (ABAC) made two recommendations on the multilateral trading system:
- Work constructively, creatively and with determination towards securing robust and meaningful outcomes at the 11th WTO Ministerial Meeting.
- Support plurilateral efforts to liberalize trade in a way that complements and supports efforts towards global liberalization under the WTO
After the 11th WTO Ministerial in December, while welcoming the ministerial decisions and informal work programs on ecommerce and micro and small and medium enterprises, ABAC’s letter to APEC Trade Ministers expressed disappointment that more ambitious outcomes were not able to be agreed in those areas, and that agreement could not be reached on fisheries and agriculture negotiations. Furthermore, ABAC emphasized that “the integrity of the global rules-based WTO trading system, including its dispute settlement mechanism and economies’ concessions and obligations, must be fully respected.” The B20, a similar business grouping that formulates recommendations to G20 leaders has stated that it is more “imperative than ever to strengthen the WTO, its rules, its monitoring instruments, and its dispute settlement mechanism.”
WHY THE NEED TO STRENGTHEN TRADE RULES?
As shown in Figure 1.8, regional economies (and indeed all economies) have been implementing a variety of measures that restrict trade. Whether they are within the WTO rules or not is immaterial to the broader economic argument that trade restrictions are bad for growth. Some (subsidies in one economy, for example) generate others (tariffs, quotas, or countervailing duties in others). Even 7 years ago there were calls for updating trade rules considering the changes that had taken place in global commerce, with former WTO Director General, Michael Moore saying “it’s not much of a stretch to say that in the modern economy, many products are no longer made in a single economy but rather, are made in the world. Our trading system needs to reflect that reality.” The failure to make any progress on the Doha Round led, among other factors, to economies seeking ways to update trade rules through bilateral and regional agreements – such as the ASEAN Plus agreements, and the TransPacific Partnership to name just two. While the WTO has begun some substantial work through its work program on ecommerce, much more needs to be done. Given the enormous technological changes that are changing business models, trade rules are badly out of synch with commercial reality. This could be addressed through more flexible approaches to rule making. One way forward could be to make better use of dialogues that promote greater understanding of the rules developed outside of the WTO framework. Such dialogues take place within APEC on the WTO plus elements of regional trade agreements.
Dispute Settlement at Risk
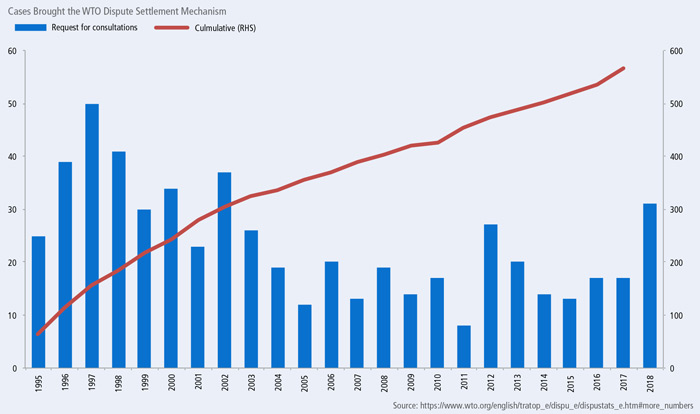
While there are tentative signs of progress on a limited set of issues, a more urgent and pressing concern is what will happen to the dispute settlement mechanism. Since 1995, over 500 disputes have been brought to the WTO, initiated by 50 members, in relation to 20 WTO agreements. Some of them have been resolved by mutual agreement by the parties involved, others required formal rulings. This indicates a widespread appreciation of the ability of the system to deal with disputes.
In practice the Dispute Settlement Body is composed of all members of the WTO which then establishes panels of experts to consider the case, and to accept or reject the panel’s findings or the results of an appeal. Panel members are usually selected in consultation with the parties to the dispute and if they cannot agree, the WTO director-general appoints them.
The process of a dispute settlement at the WTO takes around 1.25 years to complete and has not been without its critics. At the initiative of former WTO Director-General Pascal Lamy, former Deputy Director-General Alejandro Jara initiated in 2010 a process of informal consultations to find ways to make the process more efficient in line with existing rules. This process has been continued to “engage with Delegations to gather views … on improving the functioning of the system further.“
A Year Left to Save the System
In recent years there has been an impasse on agreement to new members, there are currently only 3 members of the Appellate Body and agreement on new appointments has been blocked by the United States. This is the very minimum for any decisions to be made as the Appellate Body establishes small group of 3 members to hear an appeal. By the end of 2019 the terms of 2 of the 3 remaining Appellate Body members will have completed their terms. This leaves the system vulnerable to collapse especially as more and more panel decisions are being appealed. Some suggestions for reform include:
- Making the Appellate Body a full-time assignment
- Expanding the Appellate Body Secretariat to provide law clerks for individual Appellate Body Members
- Requiring the Appellate Body Members to undertake some form of continuing education while in office.
- Increase the number of appellate body members from seven to nine
- Single but longer terms for members of the Appellate bodies
- Enforcement of the 90-day rule on appeals
- Stricter interpretation of the transition rule which allows a member to complete an appeal
There are other larger systemic concerns that have been expressed on judicial over-reach and infringements of domestic jurisdiction that cannot be simply resolved with changes such as those suggested above,13 but the avoidance of a total collapse of the dispute settlement system should be considered an imperative for any economy engaged in trade. So far participation in discussions has been limited to those who understand the intricacies of the WTO process, and it is critical for a dialogue on the importance of the WTO Dispute Settlement Mechanism to engage stakeholders from business, labor and beyond.
As far as the Asia-Pacific is concerned, support for the multilateral trading system has been a core objective for APEC since its foundation. Indeed, in trying to forge a consensus on language in support of the WTO, APEC leaders in Danang in 2017 committed “to work together to improve the functioning of the WTO, including its negotiating, monitoring, and dispute settlement functions, to adequately address challenges facing the system, bringing benefits to all of our people and businesses. We will work to ensure the effective and timely enforcement of the WTO rules.” APEC’s non-binding dialogue nature as well as its strong tradition of stakeholder engagement makes it an ideal forum for constructive engagement on this issue. Critical to any forward momentum and successful outcome will be the active engagement of the stakeholders who ultimately are impacted by any decisions emanating from the WTO.
IMPACT OF THE TRADE WAR ON ECONOMIC GROWTH
In January 2018, the US government announced that it would apply a 30 percent tariff on solar panels. This was followed by the imposition of tariffs on steel and aluminum products in February and then 25 percent tariffs on approximately $50 billion imports to the US from China in June. In turn several economies announced retaliatory measures in response, for example, April 2, 2018 China increased by 15-25 per cent its tariffs on 128 import products from the US, including fruit, wine, pork products and stainless steel.
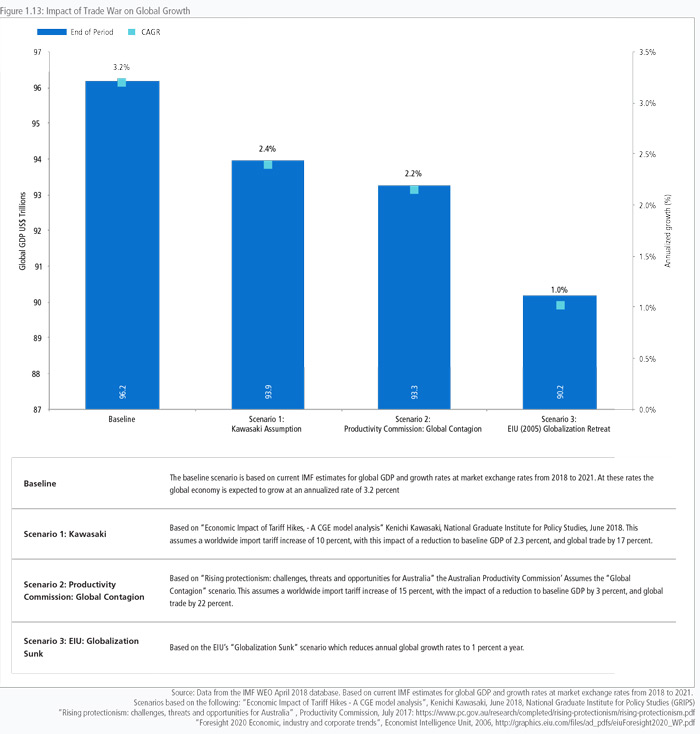
While warning that these measures could derail the recovery, the IMF notes that ‘the direct contractionary effects of recently announced and anticipated trade measures are expected to be small, as these measures affect only a very small share of global trade so far. The baseline forecast also assumes limited spillovers to market sentiment, even if escalating trade tensions are an important downside risk.’ In the IMF’s worst-case scenario, global output would be reduced by 0.5 percent in the first year and then 0.4 percent in the second year. That scenario assumes a ratcheting up of tariffs from the US and symmetrical responses from trading partners as well as a shock to global confidence. Other estimates range from a 0.3 percentage point loss by the World Bank to a 2.9 percent loss estimated by the Australian Productivity Commission, while work by Dr Ken Kawasaki at the National Graduate Institute for Policy Studies in Japan shows a drop in baseline global GDP of 2.3 percent. Work by the Bank of England estimates a loss to baseline GDP of 1 percent through the trade channel alone and an additional loss through tighter financial conditions and increased uncertainty.15 Earlier work by the Economist Intelligence Unit in 2006 suggest that a reversal of globalization would reduce annual global growth rates from 3.3 percent to just 1.3 percent.
All of these estimates use different modeling techniques but they all tend to reach the same conclusion – that an escalating trade war would have a negative overall impact on the global economy, with some economies significantly more exposed than others.16 Figure 1.13 sets out a baseline as well as scenarios based on other research on the possible impact of a trade war.
As shown in Figure 1.13, the impact of a trade war would reduce global economic growth rates to between 1 to 2.5 percent. That those growth levels would barely lift global per capita incomes is bad enough, but it is the distributive impact of such a slowdown in growth that is of central concern. Perhaps most importantly no economy comes out of a trade war unscathed – a ‘lose-lose’ situation.
IMPACT OF TRADE WARS WITHIN ECONOMIES
The more detailed breakdowns of the distributive impacts of a trade war make for an even more somber reading. The Australian Productivity Commission’s study shows that both workers and capital owners would be worse off, with wages estimated to fall by 2.5 per cent. Nearly 80 per cent of households would face lower living standards, a household that spends A$2500 a fortnight on goods and services would be worse off by A$100 a fortnight.
At the sectoral level, analysis suggests that the anticipated impact of tariff increases also vary by sector. They would decrease trade in machinery and equipment including motor vehicles and parts by about 3.5 per cent and about 1.2 percent on agriculture, forestry and fisheries.
PROGRESS ON THE APEC GROWTH STRATEGY
The APEC Growth Strategy was part of APEC’s response to the changes brought about by the Global Financial Crisis. The strategy, adopted in 2010, seeks to promote growth that is more balanced, inclusive, sustainable, innovative and secure in the region. Since its adoption it has continually featured as a top priority for APEC leaders’ discussions in PECC’s annual survey. This survey finding underlines the importance of a broader approach to regional economic policy beyond traditional trade and market access issues.
NEED FOR A BROADER APPROACH TO ECONOMIC INTEGRATION
Underlying the tensions in trade are deeper structural issues within economies. While much attention is focused on trade policy, significantly less has been paid to structural reforms. These reforms have significantly changed the internal structure of growth within regional economies, reducing the current account surpluses and deficits in the region. This should have reduced trade tensions.
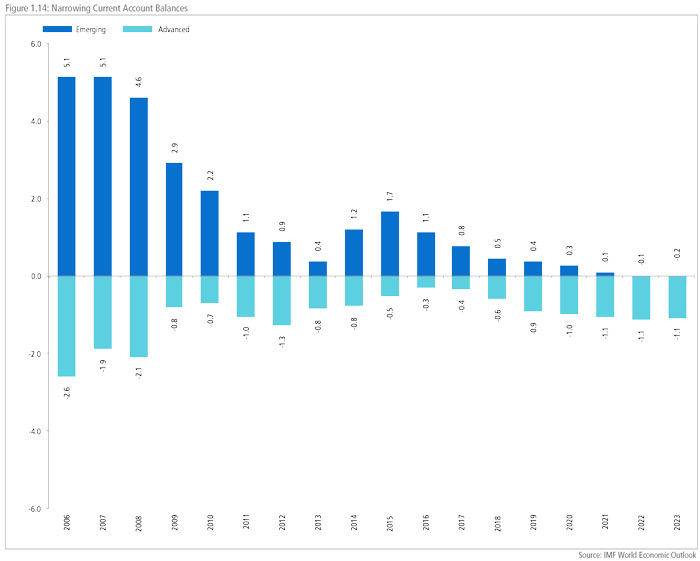
While trade growth remains positive, current account imbalances remain largely in check and some considerable distance from the peaks they reached in 2006. For example, in 2006 the US current account deficit reached a high of 6 percent of GDP while China’s surplus reached a high of 10 percent the following year. Since then, the US current account deficit has stabilized at between 2.5 to 3.5 percent of GDP while China’s surplus has shrunk to between 1.5 to 2.5 percent of GDP. While other economies in the region run relatively large current account surpluses as a percentage of GDP, in relative terms their impact on the overall structure of the regional economy is limited. As shown in Figure 1.14, while advanced economy current account deficits are expected to remain stable for the foreseeable future, emerging economy surpluses are likely to be much reduced, indicative of the important internal structural changes taking place.
In 2005, the predecessor to this report, the Pacific Economic Outlook, commenting on the imbalances warned that “the region continues to be characterized by an acute imbalance in trade and financial flows” and that “there is a growing risk of conflict between Washington and Asian trading partners.” 18 Given the general lack of attention to the domestic dimensions, it needs to be reiterated that “current account imbalances reflect private economic decisions to save and invest and are no economic problem in themselves… however, from past experience, risk generating negative political reactions in deficit economies.”19 This was an issue that the PECC discussed at great lengths especially in the lead up to the Global Financial Crisis. At its General Meeting in 2006, in considering whether the imbalances were ‘a disaster in the making’ several important points arose:
- The problem is in the structural policy fields, competitiveness market field, openness market field, regional market field, and labor market field;
- Focusing only on one dimension will prejudice our recommendations;
- What is needed is simultaneous and coordinated policy adjustments;
- It should be policy cooperation instead of policy coordination because you cannot deliver coordination. Policy cooperation means that there is a dialogue in the right fora, and that there is greater understanding of each other; and
- The root of the problem lies in the international financial architecture.
While re-emphasizing that imbalances are far from the levels they had been in 2006, those earlier warnings had not been heeded and the world went through a devastating crisis. These recommendations are essential as part of a grand bargain to avoid further escalation in the trade war.
STRUCTURAL REFORM
APEC has a long tradition of promoting structural reforms. In 2004, APEC Leaders adopted the Leaders’ Agenda to Implement Structural Reform, in 2010 they endorsed the APEC New Strategy for Structural Reform and in 2015 APEC Ministers endorsed a Renewed APEC Agenda for Structural Reform (RAASR) to guide APEC’s work on structural reform until 2020. The aim of RAASR is two-fold:
- to reduce inequality and stimulate growth in APEC economies, and
- to contribute to APEC’s overarching goal to promote balanced, inclusive, sustainable, innovative and secure growth, through measures in line with the following three pillars:
- Pillar One: more open, well-functioning, transparent and competitive markets;
- Pillar Two: deeper participation in those markets by all segments of society, including MSMEs, women, youth, older workers and people with disabilities;
- Pillar Three: sustainable social policies that promote the above-mentioned objectives, enhance economic resiliency, and are well-targeted, effective and non discriminatory.
Figure 1.15 shows the priorities that APEC economies submitted in their individual action plans under the RASSR. Collectively, the 21 economies gave updates on 80 priorities and 172 related actions. Categorizing these priorities into the three pillars of RAASR showed that 66 percent pertain to pillar #1 – more open, well- functioning, transparent and competitive markets. 46 percent pertain to pillar #2 – deeper participation in those markets by all segments of society, including MSMEs, women, youth, older workers, and people with disabilities, while 34 percent pertain to pillar #3 – sustainable social policies that promote the above-mentioned objectives, enhance economic resilience, and are well-targeted, effective, and nondiscriminatory.
While APEC’s current structural reform work covers critical areas, according to the Mid-Term Review of Progress on RAASR conducted by the APEC Policy Support Unit:
- APEC economies need to redouble their efforts towards improving business regulations and facilitating business conduct.
- APEC performed well in enhancing innovation and productivity, and should continue to strengthen these areas.
- APEC could increase efforts towards boosting the competitiveness of its labor and financial markets, paying attention to certain gaps in specific areas.
- APEC could step up measures aimed at strengthening access to basic services & infrastructure and enhancing fiscal & social policies.
- APEC could do more to deepen the participation of wider segments of society in its markets, particularly on youth employment.
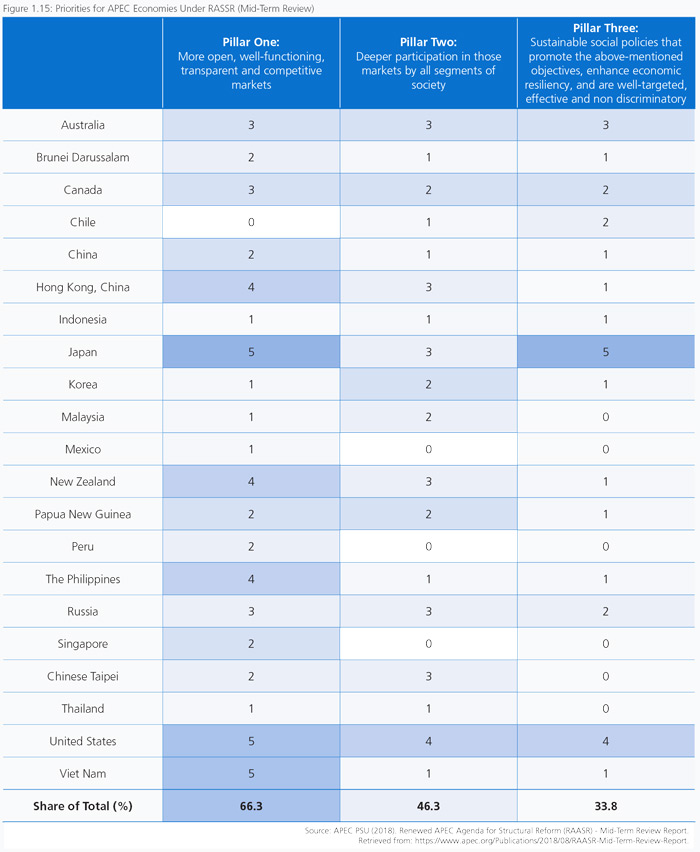
Figure 1.16 to Figure 1.19 show that there have been significant shifts in the pattern of demand within regional economies since the Global Financial Crisis. Consumption and investment as a share of GDP have been on the rise in most regional emerging economies, while net exports have decreased in importance. This has largely been in line with the thinking that drove post-crisis recovery strategies and the desire to avoid a re-emergence of the imbalanced growth that characterized the pre-crisis period. These changes have differed depending on the structure of the economy. These charts only take two specific points in time – 2007 the year before the crisis struck and 2017 (or the 2016 depending on data availability).
The headline numbers mask some important underlying factors that potentially distort broader trends, for example the impact of changes in commodity prices on government expenditures and programs dependent on them as well as the impact this has on net exports. Generally, domestic demand expansion has been driving growth in recent years. This is especially true for the region’s emerging economies. For example, consumption among Asia- Pacific emerging economies has been growing at annualized rates of 6.3 percent compared to just 1.5 percent for more advanced economies.
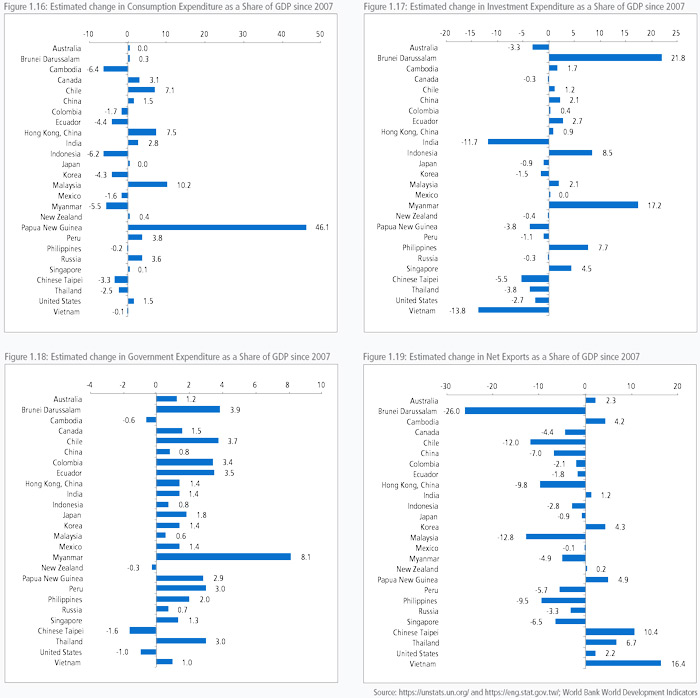
Put in US$ terms, household consumption in the region’s emerging markets has increased by around US$3.7 trillion since 2007. For the region’s advanced economies it has increased by US$2.2 trillion. As incomes grow in the emerging Asia-Pacific this trend is likely to continue and middle-class consumption become more prevalent. There is a long way to go in this trend. Among the region’s advanced economies, per capita consumption is about US$30,000 (measured at 2010 US dollars). Among the region’s emerging economies it is less than a tenth at about US$2,400. If cost of living were taken into account the picture would look slightly more even but the fundamental point that middle class consumption is likely to be a strong driver of growth for the region’s emerging economies remains.
That change in consumption patterns is deeply related to one of the underlying structural features of the region - high savings rates among Asian economies. While both Japan and the United States are considered as high-income advanced economies, Japan’s gross national savings averaged 29 percent of GDP over the past quarter of a century while the United States has been at 18 percent. At the same time, Japan’s investment to GDP ratio has been around 27 percent while the US has been at 21 percent. Further work done by PECC in the aftermath of the Global Financial Crisis looked at consumption and savings trends across the world and their likely trajectory into the future.21 It argued that private consumption growth is determined by trends in GDP growth, household income growth, household saving rates, and household wealth but that the relative importance of these factors differs greatly from economy to economy. However, as far as savings rates are concerned, the main determinants of the domestic saving rate in developing Asia are the age structure of the population (especially the aged dependency ratio), income levels, and the level of financial development.
CHANGING DEMOGRAPHIC STRUCTURES
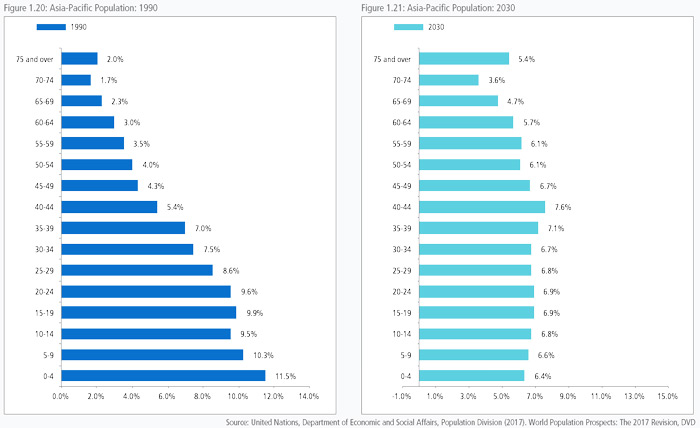
By 2030, the population of the Asia-Pacific (broadly defined as the membership of APEC, the East Asia Summit and PECC) is expected to grow to 4.7 billion people. This is a total increase of close to 420 million people. However, this headline number masks some important trends underlying the demographics of the region.
The first big population trend is ageing, the number of persons over the age of 65 is expected to increase by 266 million people, of these, 220 million will be in the region’s emerging economies and 45 million in advanced economies.
The second is that the labor force (those aged between 15-65 years’ old) is expected to increase by 201 million. Put another way, the region will need to create an additional 201 million new jobs between 2015 to 2030 to prevent mass unemployment.
The third trend is a big decline in school-aged children (those under 15). This cohort is expected to decrease by 48 million.
INVESTING IN HUMAN CAPITAL IN THE DIGITAL AGE
The challenge that the digital economy brings to human capital development was a major priority for APEC last year resulting in the endorsement of the APEC Framework on Human Resources Development in the Digital Age. The impact of new technology is the focus of the next chapter.
FUTURE SKILLS CRITICAL TO GROWTH
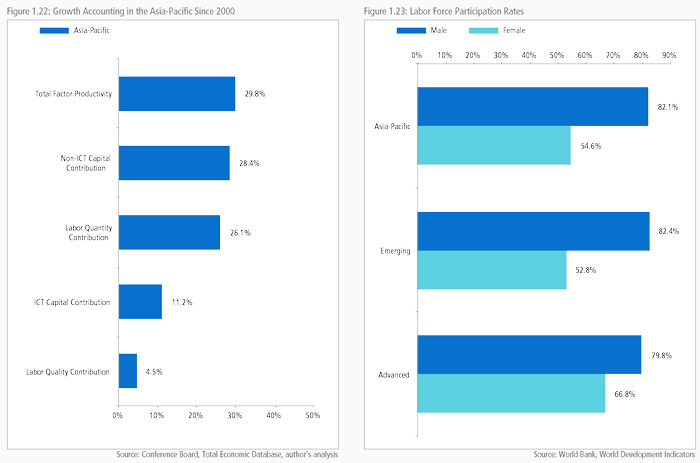
Figure 1.22 shows estimates of where growth in the region has come from since the turn of the millennium. Growth has largely come from increases in total factor productivity; investment in non- ICT capital, and labor quantity. The results vary significantly by individual economy and income levels. Of particular concern given the demographics of the region as well as rapid technological change is the relatively small percentage of growth that has come from the quality of the labor force. This is especially true for the region’s emerging economies where quality of labor has contributed significantly less to overall growth.
As populations age it is increasingly likely that labor quantity’s contribution to growth for the region’s emerging economies will be closer to that of the region’s advanced economies. However, it is by no means assured that labor quality will contribute to emerging economies growth in the same way it has for the region’s advanced economies given levels of education and rapidly changing technology without a policy intervention.
During the 1990s, as much as a fifth of the growth for the region’s emerging economies came from the amount of labor entering into the labor force. That trend for emerging economies continued strongly in the 2000s but slowed this decade. That slowing trend for emerging economies is likely to continue given the rapid ageing of the population. However, a large caveat to this argument is that female participation rates in the labor force remain stubbornly low in the region. As shown in Figure 1.23, the female labor force participation rate is only 54 percent compared to 63 percent among OECD members. In absolute terms for the broad Asia-Pacific, if the female participation rate was the same as the male this would mean an additional 400 million people in the labor force.
While traditional growth accounting looks at labor productivity as a single number, the Conference Board’s Total Economy Database breaks down labor into quality and quantity. The quality of labor or labor composition is calculated based on educational attainment. While an imperfect proxy, this methodology provides a useful way to distinguish between the amount of labor in the economy and its quality. Since 2000, the quality of the labor force in the region’s advanced economies has contributed around a fifth to growth compared to only 6 percent for emerging economies. Put another way, the region’s emerging economies could improve labor productivity by focusing on education and skills.
As already noted, the policy community believes human resource development in the digital age should be a top priority for APEC leaders. Much has and will continue to be written about the impact of technological change on regional economies. These changes have been brought about by the rapid changes and adoption of new technologies and their applications across societies ranging from mobile payment systems, online banking and tele-health and online education to ecommerce. The trend that started in the 1990s with the increased penetration of the internet continues. Investment expenditure on information and communication technology (ICT) accounted for about a quarter of the region’s growth in the 1990s but dropped to a tenth in the 2010s. This raises the issue of how ‘digital’ is measured and the extent to which it is commensurate with ICT. Perhaps of greater concern is that while ICT investments were a fifth of growth for the region’s advanced economies, they appear to have been only 7 percent of the region’s emerging economies.
FUTURE OF REGIONAL COOPERATION AND INTEGRATION
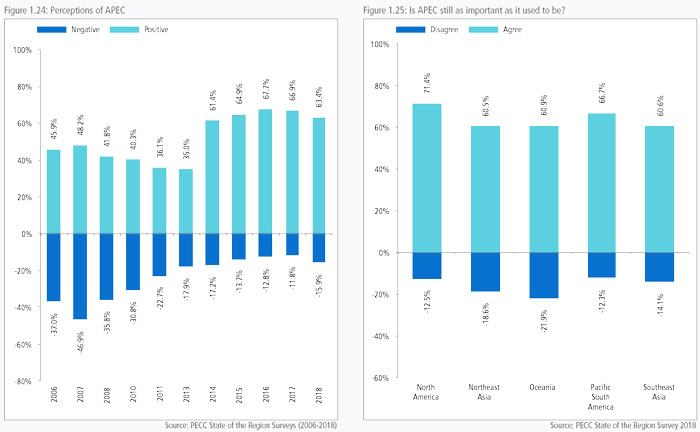
In spite of concerns over protectionism as a risk to growth and the backlash against trade and globalization in some economies, APEC continues to be seen as an important institution among stakeholders. Indeed, APEC’s enduring value may well be its nonbinding nature and as an incubator for initiatives that can be taken forward in other processes. As seen in Figure 1.24, the percentage of respondents who had a positive view of APEC over the past ten years has steadily improved from a net approval rating of 1.3 percent in 2007 to around 50 percent over the past 4 years. The positive view of APEC is broadly shared across the region with the highest positives amongst North American respondents (Figure 1.25). Tracking perceptions over time shows the most improvement in perceptions of APEC among North American and Southeast Asian respondents. Negative assessments have fallen sharply since the Global Financial Crisis, perhaps a reflection of reduced and more realistic expectations of APEC as an institution.
While there was broad support for the idea that APEC should expand its membership with 47 percent agreeing and 21 percent disagreeing, only 13 percent thought that this should be a priority concern at this point in time. As discussed earlier in this section, while a clear majority of respondents thought that APEC’s work on trade should focus on achieving an FTAAP, the negative assessment of the political environment for freer trade and investment provides a reality check. This should not mean that regional economic integration initiatives should stop; indeed, they provide important forward momentum at a time when barriers to trade are being raised unilaterally. APEC and other regional mechanisms can provide a platform for constructive engagement on issues where significant gaps on understanding remain.
As much as trade issues dominated concerns from stakeholders in this year’s survey, it is also clear that the impact of technological change is likely to be at the forefront of concerns over the coming years. Those issues should be seen as a part of a broader set of economic policy issues that require cooperation if not coordination. Those issues form the suite of structural policies that require a much clearer focus.
<< Previous
Next >>