CHAPTER 3-INDEX OF ECONOMIC INTEGRATION IN THE ASIA-PACIFIC *
CONTRIBUTED BY DR. BO CHEN*
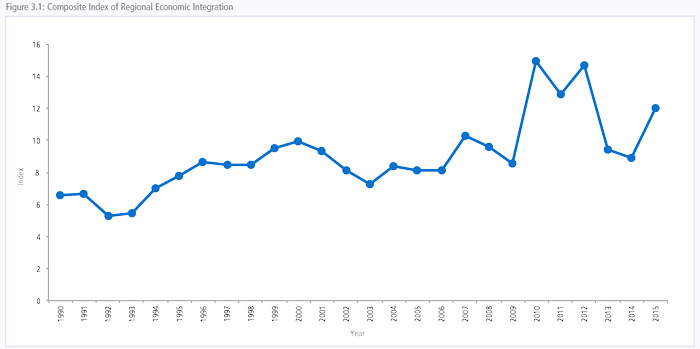
The latest update to PECC’s index of economic integration in the Asia-Pacific region shows a rebound after two consecutive years of falling. The rebound comes mainly from growth in intraregional flows of tourists as well as greater levels of convergence in educational expenditure.
The index measures the degree of integration taking place in the Asia-Pacific region based on intraregional flows of: goods; investment; tourists; and five measures of convergence: gross domestic product (GDP) per capita; share of non-agriculture to GDP; the urban resident ratio; life expectancy; and share of education expenditure in gross national income (GNI). The index was developed in 2008 as a tool to measure the degree of integration taking place in the Asia-Pacific. Regional economic integration has become a core objective of the Asia-Pacific Economic Cooperation (APEC) forum. The process of economic integration is commonly defined as the intra-regional freer movement of goods, services, labor, and capital across borders.
The degree of economic integration can be analyzed at bilateral, regional, and global levels. Even though the Asia-Pacific region is not covered by a single trading agreement, there is much anecdotal evidence to suggest that it is becoming more integrated. It is well known that parts of the region are already highly integrated through production networks that facilitate trade of intermediate and finished goods across borders. Since 1998, many economies in the region have negotiated bilateral and sub-regional free trade agreements with partners in as well as outside the region. APEC Leaders have also endorsed a proposal to investigate the idea of a Free Trade Area of the Asia-Pacific (FTAAP), which if successful, would constitute the largest regional trading bloc in the world.
An important feature of the index is that it excludes trade and investment flows among geographically contiguous sub-regional trading partners, namely the North American Free Trade Agreement (NAFTA), the ASEAN Free Trade Area, and Australia-New Zealand Closer Economic Relations. It also excludes flows among China, Hong Kong (China), and Chinese Taipei. This is to control for the effect that sub-regional flows may have on the index, whereby a very high degree of integration among, for example, NAFTA economies could result in a falsely high measure of integration with the Asia-Pacific region as a whole.
Furthermore, since trade, investment, and tourism measures are calculated relative to global transactions, the index will rise for a given economy only if that economy’s share of intraregional trade/ investment is growing relative to total trade and investment.
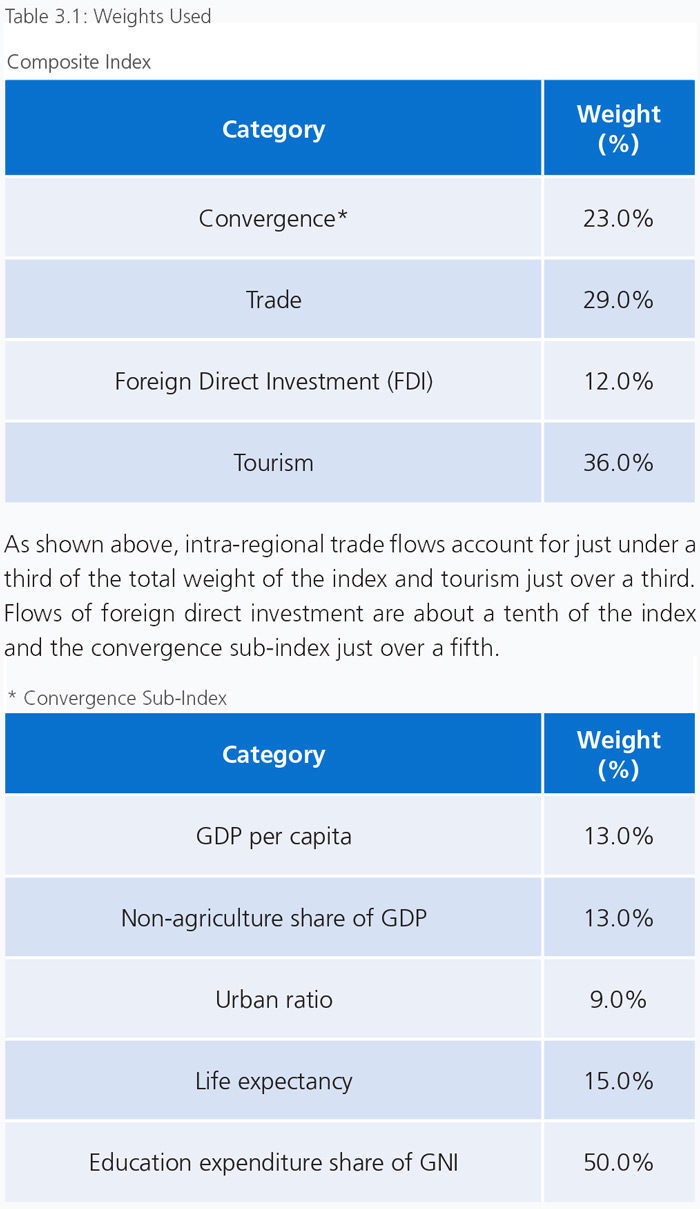 The weights given to each dimension are determined using principal component analysis.
The convergence measures are premised on the notion that integration will lead to greater uniformity among the economies. Education expenditure as a share of GNI makes up half of the weight of the sub-index with per capita incomes, non-agricultural share of GDP, the urban ratio; and life expectancy around a tenth each.
These weights were derived using principal component analysis. As per the methodology, more trade and investment among regional partners may not translate into a higher score on the integration index if, at the same time, partners are diverging in terms of incomes, education expenditure, life expectancy, urbanization, and economic structure.
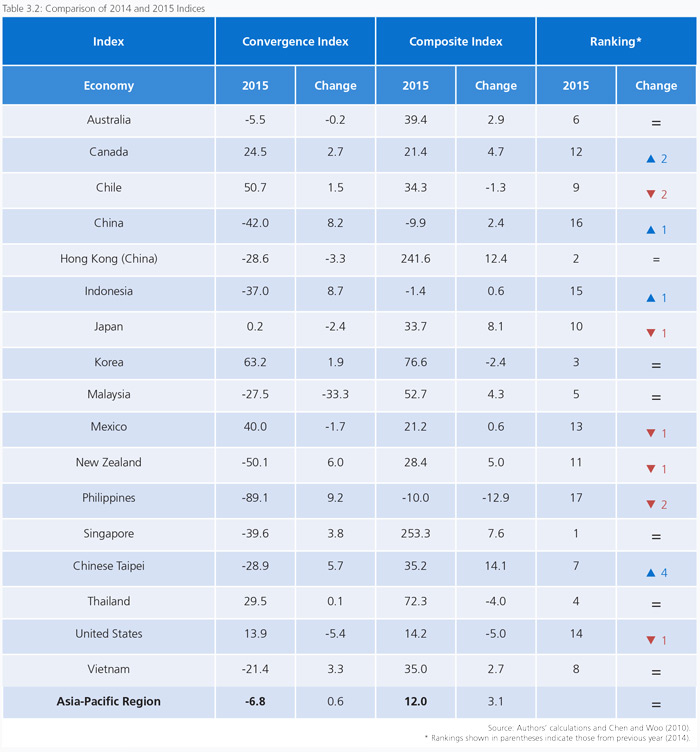
Caution should be exercised in the interpretation of these findings. The measures chosen for inclusion in the composite index are imperfect indicators of convergence and trade/investment integration. The rankings in turn should not be read normatively as “league tables” in the sense that a higher ranking is superior to a lower ranking. A low ranking may simply indicate that an economy is oriented more globally than regionally, as is likely the case for China and the United States.
Nevertheless, the change in index value for a given economy over time can be read as a measure of its changing economic orientation. The index value for the region as a whole can also be seen as a measure of closer economic ties among Asia-Pacific economies and as one indicator of APEC’s success.
The 2018 update to the index is based on the latest data available for the selected dimensions from 2015. Missing data were approximated using standard interpolation and extrapolation techniques.
The most recent figures showed a rebound in the index. Since the Global Financial Crisis, economic integration in the Asia-Pacific has been volatile. The 2018 update (for the indices up to 2015) by economy shows that the overall convergence process continued to rebound, albeit slightly. As a result, 11 out of the 17 Asia-Pacific economies included in this study became more converged against the average mean level of the Asia-Pacific region in the year before.
The overall convergence index resumes its increasing trend after dropping in recent years. Based on the most recent data available, the deviations from the regional averages of GDP per capita, nonagricultural GDP share, urbanization, life expectancy as well as education expenditure dropped this year compared to last year.
ASIA-PACIFIC TRADE FLOWS
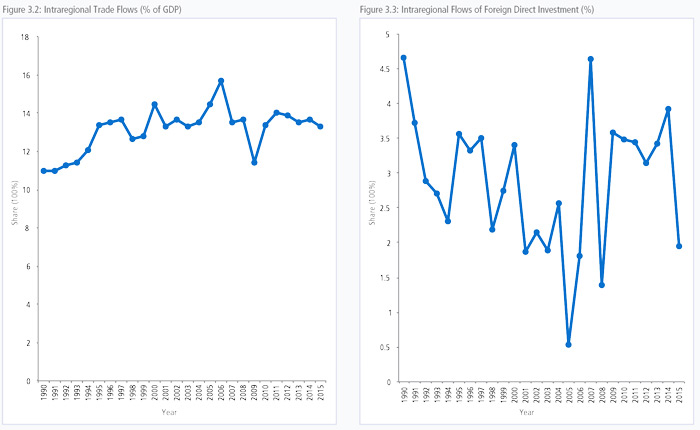
Figure 3.2 shows the share of Asia-Pacific intra-regional imports and exports to regional GDP. Though economic recovery in the region has been substantial as discussed in Chapter 1 of this report, intra-regional trade, while significant, remains below its peak reached before the Global Financial Crisis. The intra-regional trade flow share slightly declined to 13.3% in this year’s update from 13.6% compared to the peak reached in 2006. The weak recovery can be mainly attributed to two reasons. First, China’s has been experiencing economic structural change since 2012 and its trade growth has lost its pace since then. Second, US economic recovery, though quite robust, does not translate into a strong external demand as expected. It should be re-emphasized here that this index discounts flows among sub-regions: the economies of Southeast Asia, North America and those among China, Chinese Taipei and Hong Kong (China).
The share of Asia-Pacific intraregional merchandise trade recovered from the big hit in 2009. However, the recovery was not robust and the recovery trend has been zigzag. Indeed, only 5 out of the 17 included economies show an increase in their intra-regional trade shares: Vietnam, Mexico, Canada, Hong Kong (China), and Chinese Taipei.
FOREIGN DIRECT INVESTMENT
As shown in Figure 3.3, compared to flows of goods, intraregional flows of investment show a much more erratic pattern. It had a dramatic drop in 2009 due to the Global Financial Crisis and, while it has recovered, it has not been a substantial factor impacting overall integration. Investors still hold sensitive and conservative attitudes towards the regional economic recovery.
TOURISM FLOWS
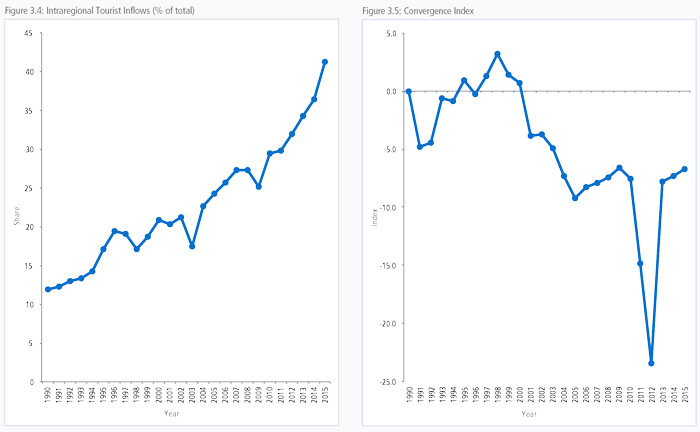
Figure 3.4 shows the recovery trend of the intraregional tourism. It indicates that the intraregional tourist share (to every 1,000 citizens in hosting economy of the sample) increased further to reach new heights in 2015. Except for the declines seen in 2007-2009 and 2010-2011, intraregional tourist flows have grown substantially from 17.5 tourist per 1000 citizens in 2003 to more than 41.2 in 2015, the highest level recorded in our index.
CONVERGENCE INDEX
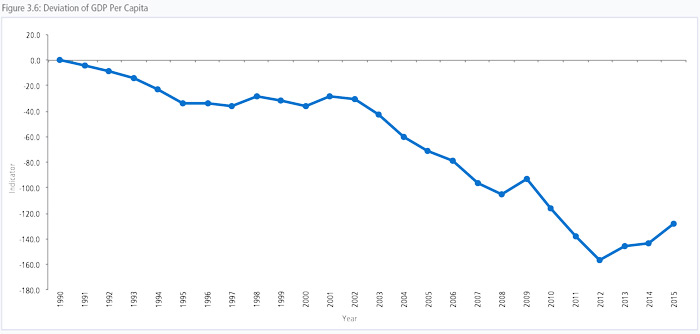
The sub-index of convergence shows a rebound in overall convergence in the region based on the 5 dimensions of convergence included as shown in Figure 3.5.
LESS DIVERGING INCOMES
While GDP per capita levels in the region had been significantly increasing from its 1990 level, deviation from the regional average also increased after 2000. Such divergence trend had been slightly mitigated after 2012. It should be noted here that GDP per capita accounts for just 13 percent of the weight of this sub-index while education expenditure accounts for 50 percent of the weight. Shifts towards convergence in education, even minor ones, could outweigh much larger shifts in income.
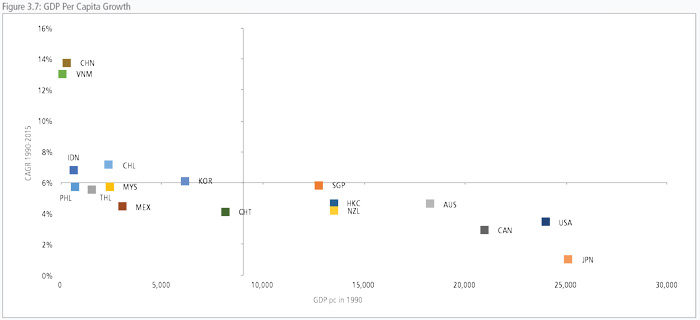
Over the entire index period, the divergence in incomes has been driven by differences in growth rates. In 1990, the average GDP per capita in the region was around US$9000, with average growth rate of 6 percent. However, as expected, some economies that had lower incomes in 1990 have had very high growth rates over above 10 percent a year while others grew at or below the regional average. Moreover, some with higher incomes continued to perform strongly near the regional average. For incomes to converge, economies with lower starting GDP per capita levels would need to grow at a much faster rate than those with higher starting levels. Figure 3.7 shows the GDP per capita levels of regional economies in 1990 and the average growth rate over the past 26 years.
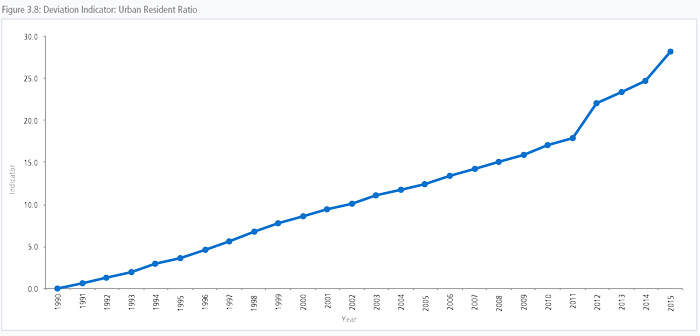
The pace of urbanization in developing economies in the region has been chasing that of the developed ones throughout the period as represented by the deviation indicator of urban population as shown in Figure 3.8. In 1990, the average urban resident ratio of these 17 included economies was 65.2 percent with a standard deviation of 21.9. By 2015, the urban resident ratio had increased to 75.1 percent with a standard deviation of 16.2, where all economies showed increase in urbanization and the figures have been converging at a similar rate. As seen in Figure 3.8, this has been a very linear and consistent trend in the region.
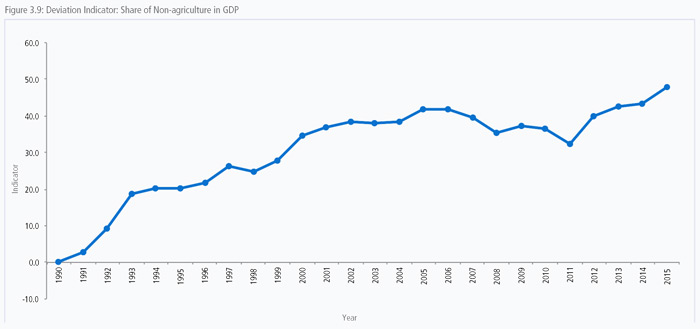
Unlike the convergence shown in the pace of urbanization, the share of non-agriculture in GDP has been much more volatile, with some significant dips taking place in 2007 and again in 2010. However, a strong rebound occurred in 2011 and the convergence level has been back on the rise since then. As shown in Figure 3.9, the indicator exceeded the previous peak in 2006. According to the data, the average share of non-agriculture in GDP increased to 94.6 in 2015 from the previous peak of 94.0 in 2006 while the standard deviation across the economies shrunk from 4.8 to 4.3.
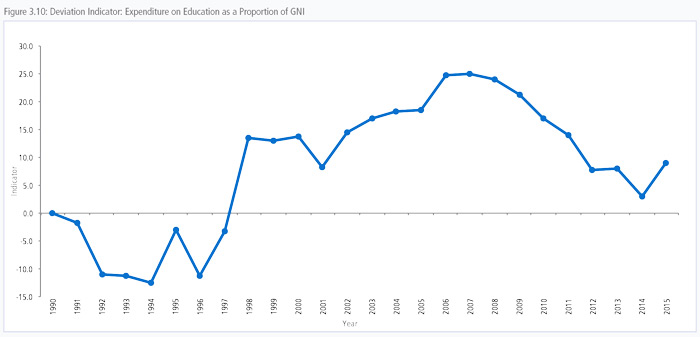
While the proportion of expenditure on education in the region has significantly risen to 4.3 percent compared to 3.42 in 1990, Figure 3.10 shows that the convergence of education expense share declined from declined from 2008 until 2014. Underlying this decline was significant divergence in the percentage of GDP spent on education by Asia-Pacific economies.
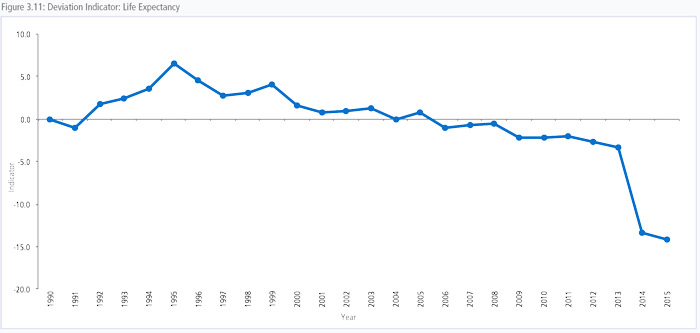
In 1990, the average life expectancy in the region was 73.6 years with a standard deviation of 3.5. By 2015, it had increased by almost 5 years to 78.6, with a standard deviation of 4.0. As seen in Figure 3.11, between 1990 and 1995, life expectancies had been converging. However, the level of convergence began to decrease thereafter. The latest update to the index shows that the level of convergence in life expectancy in the region is persistently below the level in 1990 after 2006. This means life expectancy is increasing faster in certain economies than others.
When APEC Leaders set out the Bogor Goals in 1994, they set out a vision through which the region would not only maintain high growth rates but also narrow development gaps. While the region has done well in integrating and overall incomes have increased at a dramatic pace, the index shows that there is a long way to go in terms of closing development gaps. Integration is not an end in itself but a means to ensuring that all citizens can achieve their potentials. A broader and deeper economic cooperation in Asia-Pacific region such as the FTAAP is desired to maintain and accelerate to integration process.