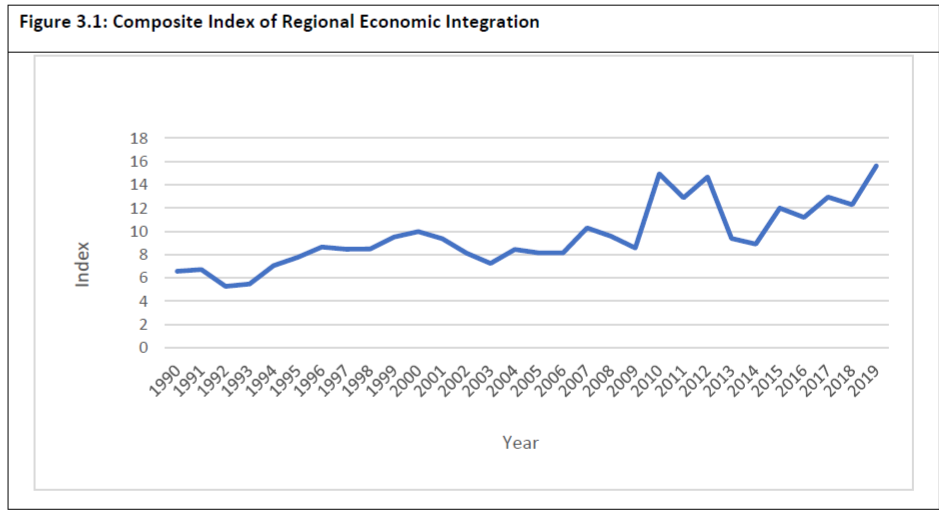
The latest update to PECC’s index of economic integration in the Asia-Pacific region in 2019 continued to show an increased level of integration, even surpassing the previous peak in 2010. The increase in the index reflects the process of the economic integration in the Asia Pacific region has achieved solid progress regardless of the US-China trade war initiated in 2018, which indicates a substitution effect rather than a destruction effect of the trade war in the Asia Pacific region, at least for 2018 and 2019.
The index measures the degree of integration taking place in the Asia-Pacific region based on intraregional flows of: goods; investment; tourists; and five measures of convergence: gross domestic product (GDP) per capita; share of non-agriculture to GDP; the urban resident ratio; life expectancy; and share of education expenditure in gross national income (GNI). The index was developed in 2008 as a tool to measure the degree of integration taking place in the Asia-Pacific. Regional economic integration has become a core objective of the Asia-Pacific Economic Cooperation (APEC) forum. The process of economic integration is commonly defined as the intra-regional freer movement of goods, services, labor, and capital across borders.
The degree of economic integration can be analyzed at bilateral, regional, and global levels. Even though the Asia-Pacific region is not covered by a single trading agreement, there is much anecdotal evidence to suggest that it is becoming more integrated. As defined by the APEC membership, the region consists of not only developed economies such as the United States, Japan, Canada, and Australia, but also emerging markets from ASEAN. It is well known that parts of the region are already highly integrated through production networks that facilitate trade of intermediate and finished goods across borders. Since 1998, many economies in the region have negotiated bilateral and sub-regional free trade agreements with partners in the region as well as outside the region. APEC Leaders have also reaffirmed their commitment “to advance the process in a comprehensive and systematic manner towards the eventual realization of the FTAAP as a major instrument to further APEC’s regional economic integration agenda”, which if successful, would constitute the largest regional trading bloc in the world.
An important feature of the index is that it excludes trade and investment flows among geographically contiguous sub-regional trading partners, namely US-Mexico-Canada Agreement (the updated NAFTA Agreement), the members of ASEAN, and Australia-New Zealand Closer Economic Relations. It also excludes flows among China, Hong Kong (China), and Chinese Taipei. This is to control for the effect that sub-regional flows may have on the index, whereby a very high degree of integration among, for example, USMCA economies could result in a falsely high measure of integration with the Asia-Pacific region as a whole.
Furthermore, since trade, investment, and tourism measures are calculated relative to global transactions, the index will rise for a given economy only if that economy’s share of intraregional trade/investment is growing relative to total trade and investment.
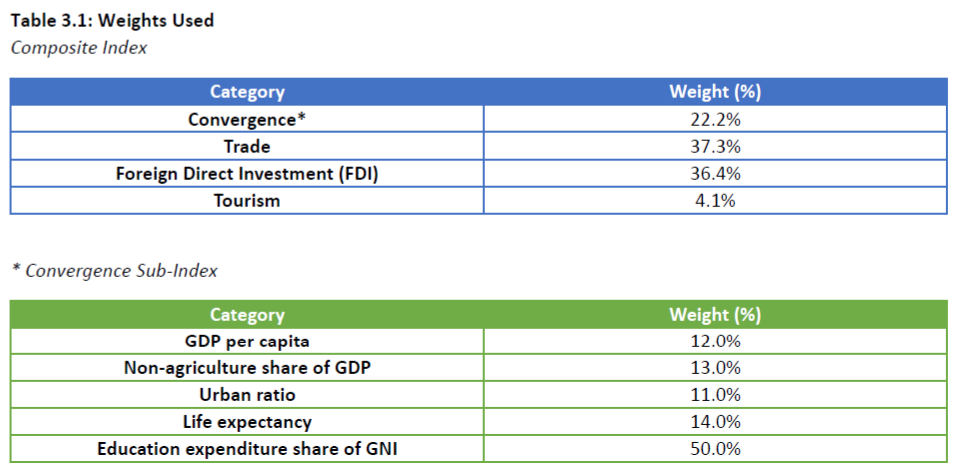
The weights given to each dimension are determined using principal component analysis.251
The convergence measures are premised on the notion that integration will lead to greater uniformity among the economies. Accordingly, more trade and investment among regional partners may not translate into a higher score on the integration index if at the same time the partners are diverging in terms of income, education, life expectancy, urbanization, and economic structure.
Caution should be exercised in the interpretation of these findings. The measures chosen for inclusion in the composite index are imperfect indicators of “convergence” and trade/investment integration. The rankings in turn should not be read normatively as “league tables” in the sense that a higher ranking is superior to a lower ranking. A low ranking may simply indicate that an economy is oriented more globally than regionally, as is likely the case for China and the United States.
Nevertheless, the change in index value for a given economy over time can be read as a measure of its changing economic orientation. The index value for the region as a whole can also be seen as a measure of closer economic ties among Asia-Pacific economies and as one indicator of APEC’s success.
Nevertheless, the change in index value for a given economy over time can be read as a measure of its changing economic orientation. The index value for the region as a whole can also be seen as a measure of closer economic ties among Asia-Pacific economies and as one indicator of APEC’s success.
The 2021 update to the index is based on the latest data available for the selected dimensions from 2019. Missing data were approximated using standard interpolation and extrapolation techniques. Furthermore, in the following text, we compared the most updated 2019 indices/indicators with the 2015 counterparts as the 2015 ones is in the most recent report.
The most recent figures showed a robust increase in the index even though the fierce US-China trade war began in 2018. The more integrated economies in Asia Pacific region show a more frequent exchange on goods, capital, and people. The US-China trade war might lead a more reallocation of the supply chains than the destruction of them, at least up to 2019. Overall, the 2021 update for the convergence indices continues its rebound after 2013 albeit a slight decrease in 2019 compared to 2018. As a result convergence increased for 11 out of the 17 Asia-Pacific economies included in this study.
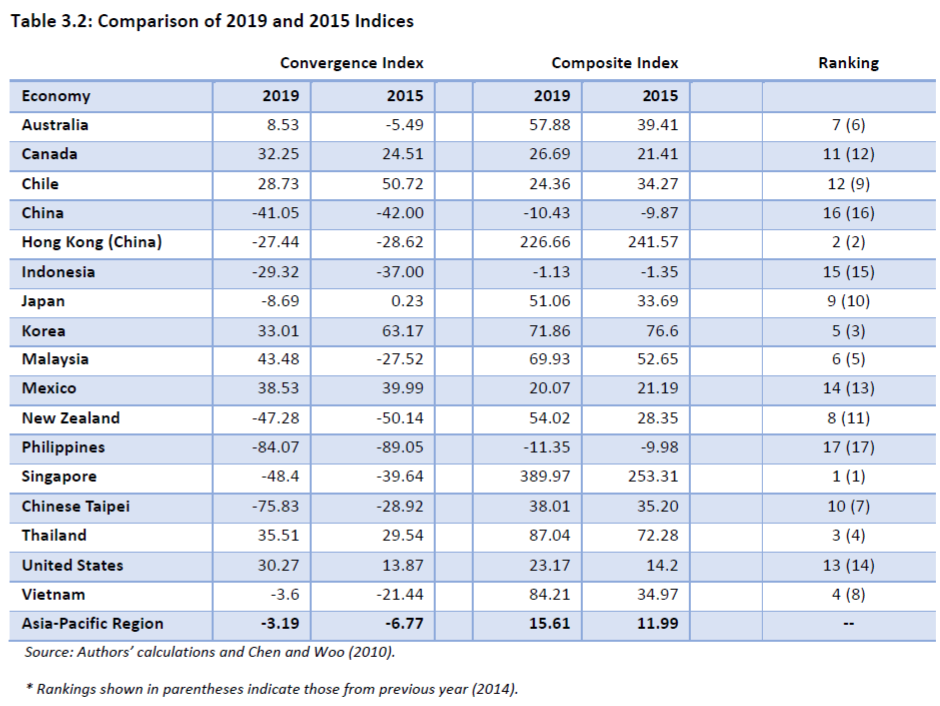
Noticeably, Singapore and Hong Kong (China) are still the most integrated economies with the AP markets. As the freest business harbors, Singapore and Hong Kong (China) benefit the most from economic integration in trade, investment, and tourism. The Philippines, however, still has the biggest gap behind the regional average, and its convergence ranking remains the lowest amongst all 17 economies in both 2015 and 2019.The overall convergence index in 2019 resumes its increasing trend after 2013, reflecting that Asia Pacific economies exhibited a more balanced development pattern and thus the gaps between the 17 economies, which are measured by deviations from the regional averages of GDP per capita, non-agricultural GDP share, urbanization, life expectancy as well as education expense ratio, became smaller in 2019 compared to 2015. Furthermore, it is worth noting that Vietnam’s performance is outstanding. In 2015 Vietnam was ranked the 8th, in the middle of the rankings. However, after 4 years, Vietnam’s convergence index measurement quickly increased from 34.97 in 2015 to 84.21 in 2019, lifting it from the 8th to 4th place. Data shows that Vietnam had a significant increase in convergence measures as well as its trade, investment, and tourism interactions with other Asia Pacific economies.
Asia-Pacific Trade Flows
Figure 3.2 shows the share of Asia-Pacific intra-regional imports and exports to regional GDP. The intra-regional trade flows in 2018 and 2019 were declining significantly, due to the US-China trade war. The intra-regional trade flow share to GDP declined to 12.43‰ in 2019 from 14.92‰ in 2015 and its peak of 16.30‰ in 2011. The US-China trade war has contributed to the weaker intra-regional trade flow mainly via two channels. First, one of the U.S. purposes has been to bring manufacturing jobs back home. As a result, part of the decline in trade is a result of U.S. increased domestic production. Second, the high tariffs imposed by both economies deter some bilateral trade and affect other economies (mainly in the Asia Pacific region) on the same value chain. It should be re-emphasized here that this index excludes flows among sub-regions: the economies of Southeast Asia, North America and those among China, Chinese Taipei and Hong Kong (China).
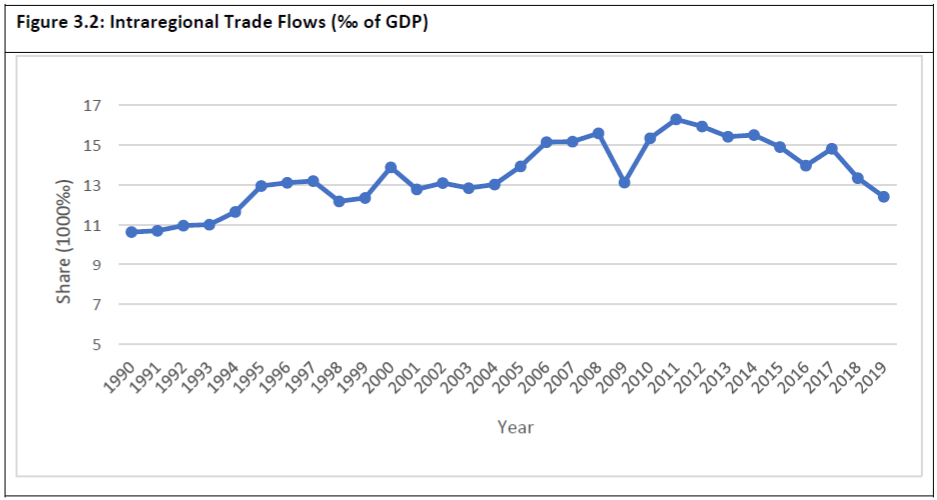
Compared to 2015, in 2019 only 6 out of the 17 included economies show an increase in their intra-regional trade shares: the Philippines, Vietnam, Mexico, Canada, Australia, and New Zealand. Meanwhile, major trading economies, such as China, the United States, Japan, and Korea, have nontrivial decreases, which mainly occurred in 2018 and 2019.
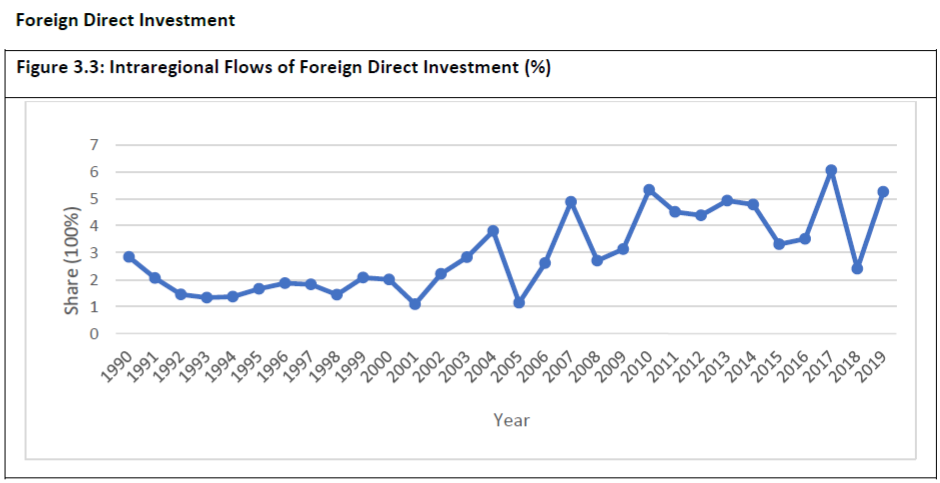
Compared to flows of goods, intraregional flows of investment show a much more erratic pattern in figure 3.3. The intraregional FDI flow shares are measure as the ratios of bilateral FDI (annual change of the FDI stock) within these 17 included economies versus their own capital formation. It reached its peak in 2017, tumbled in 2018, and rebounded in 2019. The most recent volatility is believed mainly due to the US-China trade war. Before the trade war occurred in 2017, the substantial economic growth in both economies and stable relations attracted investors confidently invest to them as well as the whole region. While the trade war caused investors to pause their investment. By 2019 many believed that the trade war could not be quickly resolved as they had hoped and started to reallocate their investment to other places to avoid the tariff and non-tariff barriers imposed by these two major economies. Data breakdown shows that China lost FDI significantly in 2019 to the lowest in our study (i.e. from 1990-2019) while the United States received the highest. Interestingly, the overall bilateral FDI in the Asia Pacific region shows that the 2019 level is indeed the second highest during 1990-2019. It implies that the reallocation of intraregional FDI, rather than destruction, is dominant under the trade war.
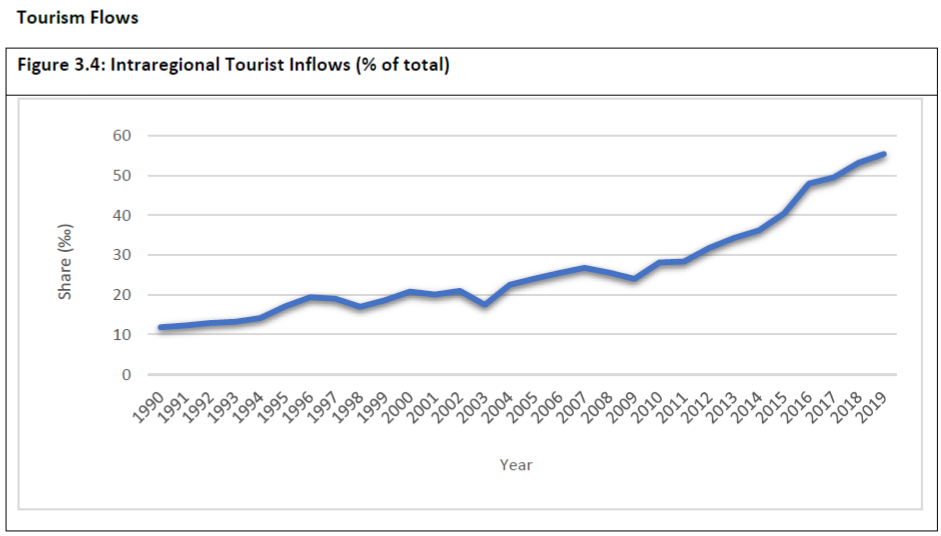
Figure 3.4 shows the substantial increase of the intraregional tourism in the years prior to the pandemic. It indicates that the intraregional tourist share (to every 1,000 citizens in hosting economy of the sample) has continually broke its record compared to the previous year since 2011.
Except for the declines seen in 2007-2009 and 2010-2011, intraregional tourist flows have grown substantially from 17.5 tourists per 1000 citizens in 2003 to more than 40.48 in 2015 and more than 55.38 in 2019.
According to the data, Japan remains the largest recipient of inbound regional tourists, more than 29 million tourists in 2019. Besides Japan, there are five more economies that welcomed more than 10 million tourists, namely, Thailand, Vietnam, China, the United States, and Korea. It is worth noting that the tourists to Vietnam have increased dramatically since 2015: it had 4.7 million intraregional tourists (note that the number did not include those from ASEAN economies) in 2015 and more than 13.4 million in 2019, making it a new 10-million-tourist-economy club member since 2018.
However, as with trade and investment flows, the Covid-19 pandemic will have had a dramatic effect on intraregional tourist flows setting back regional integration significantly. While trade in goods recovered in late 2020 and through 2021, and although FDI flows to the region dropped significantly in 2020 as discussed in chapter 1 there are reason for believing that they may recover in 2021, many restrictions to the movements of people will remain in place due to Covid-19 as well as a reluctance to travel.
Convergence Index
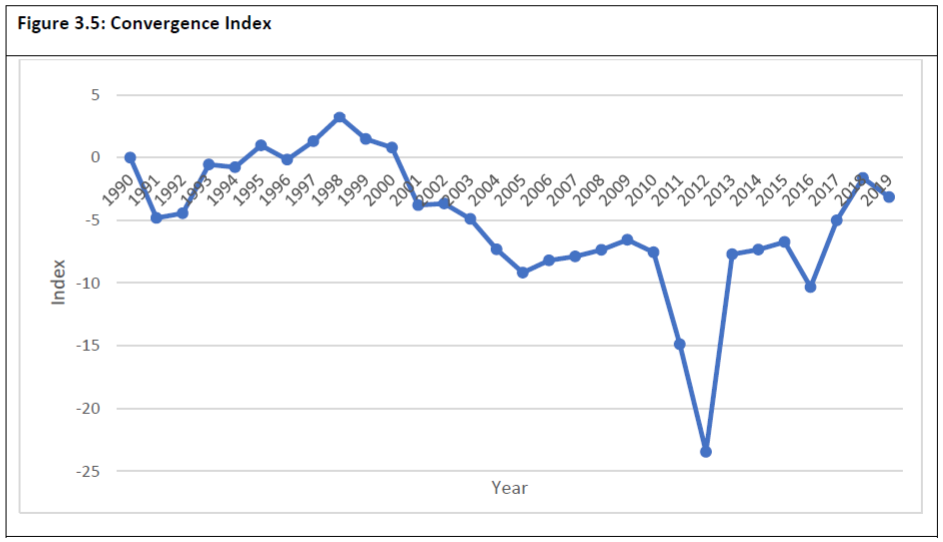
The sub-index of convergence shows that economies in the region have overall rebounded since 2015 albeit with a slight decline in 2019. GDP per capita levels in the region had been significantly increasing from its 1990 level. However, the deviation from the regional average has increased even over 1990. This divergence trend slowed during 2012 to 2016 but resumed again until 2019. It should be noted here that GDP per capita accounts for just 12 percent of the weight of this sub-index while education expenditure accounts for 50 percent of the weight. Shifts towards convergence in education, even minor ones, could outweigh much larger shifts in income.
More Diverging Incomes Again
Figure 3.6 shows that the convergence indicator of GDP per capita (measured in current US$) rebound after 2012. However, it. becomes less convergent after 2016. The decreasing trend resumed after 2016 since some of the developed economies such as the United States and Korea performed much better than before and their rising GDP per capita diverged further from the regional average.
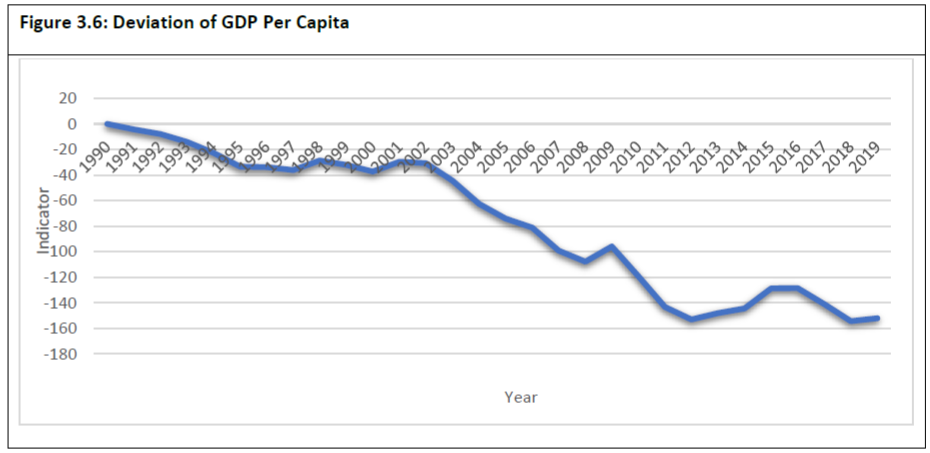
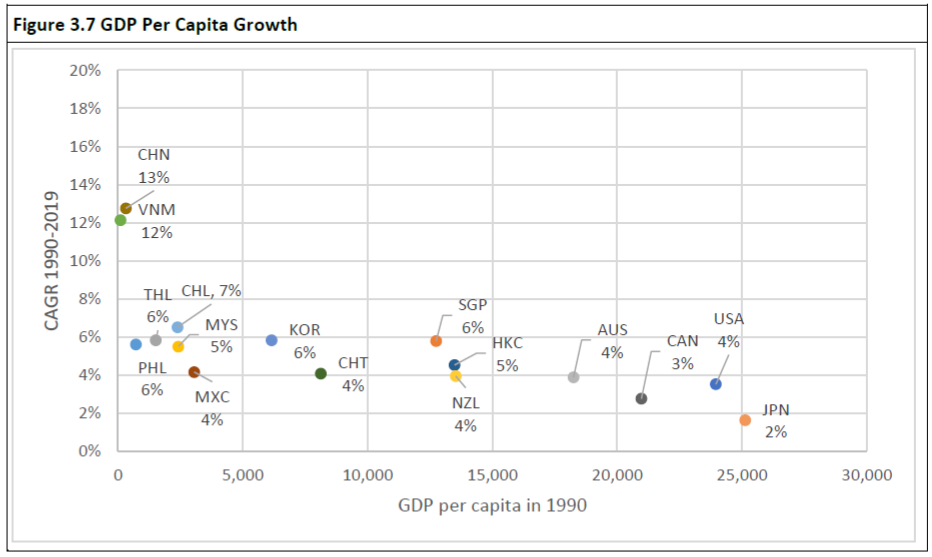
Over the entire index period, the divergence in incomes has been driven by differences in growth rates. Over the 30 years between 1990 and 2019, GDP per capita grew by 216 percent (in nominal terms), or at a compound annual growth rate (CAGR) of about 4.81 percent. However, income levels in some economies have grown at a much higher rate than the average in the region while others under the average. For incomes to converge, economies with lower starting GDP per capita levels would need to grow at a much faster rate than those with higher starting levels. Figure 3.7 shows the GDP per capita levels of regional economies in 1990 and the average growth rate over the past 30 years. For incomes to converge, those economies in the bottom left need to move up towards where China and Vietnam are positioned.
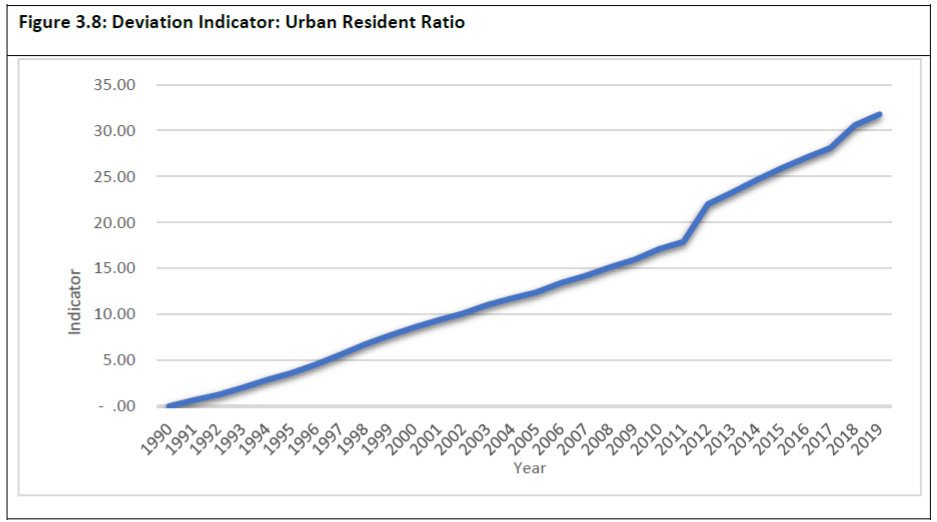
The pace of urbanization in developing economies in the region has been chasing that of the developed ones throughout the period as represented by the deviation indicator of urban population as shown in Figure 3.8. In 1990, the average urban resident ratio of these 17 included economies was 65.2 percent with a standard deviation of 21.9. By 2015, the urban resident ratio had increased to 75.06 percent with a standard deviation of 16.23. In 2019, the ratio further increased to 75.55 with a standard deviation of 14.94. The statistics show that all economies increase in urbanization with developing economies persistently catching up the developed ones. As seen in Figure 3.8, this has been a very linear and consistent trend in the region.
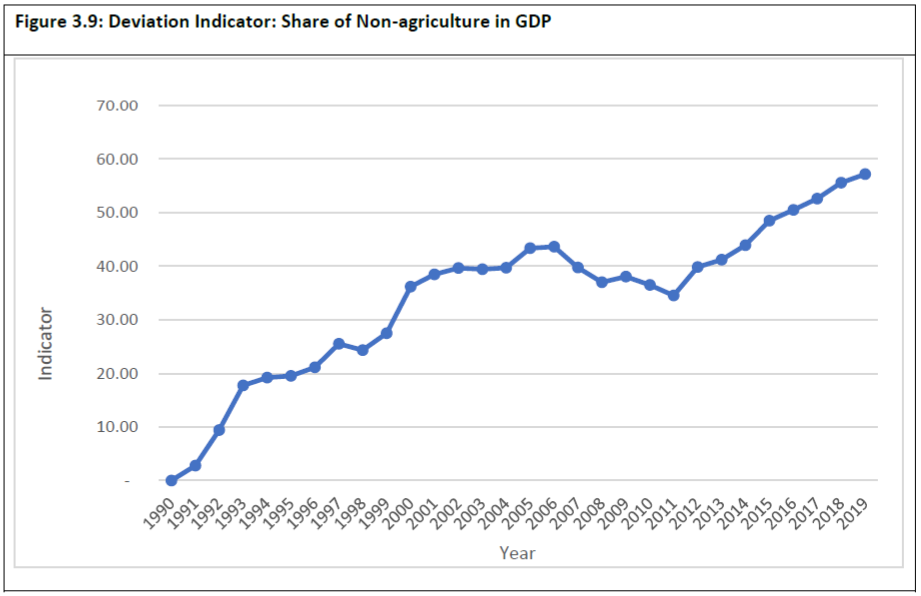
The convergence trend in the pace of urbanization resembles that of the urbanization. The share of non-agriculture in GDP has been persistently increasing after 2011, with the 2019 index reached the all-time height. According to the data, the average share of non-agriculture in GDP was 94.59 in 2015 and increased to 95.30 in 2019 while the standard deviation across the economies shrunk from 4.26 to 3.54.
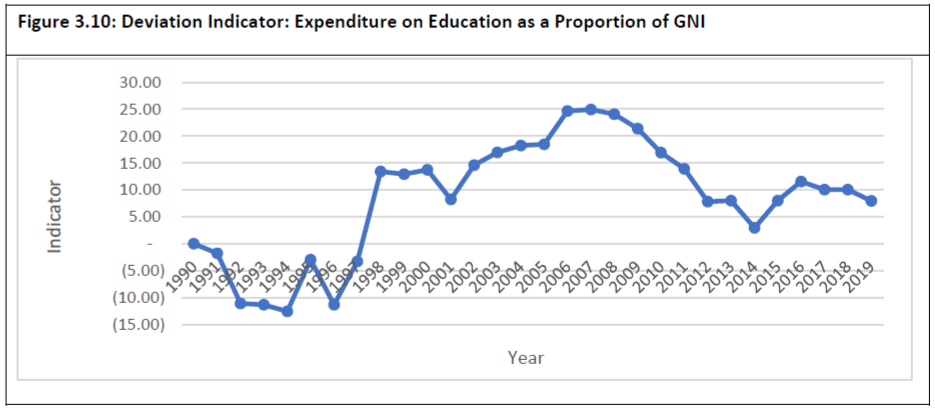
While the proportion of expenditure on education in the region has significantly risen to 4.28 percent in 2019 compared to 3.42 in 1990, Figure 3.10 shows that the convergence of education expense share nevertheless has declined since the 2007 peak. Though there was a modest rebound during 2014-2016, the overall trend still clearly indicates that the education situation in the Asia Pacific region diverged. The economy specific data show that 6 out of the 17 Asia-Pacific economies reduced their share of GNI on education in the past 5 years (i.e. 2015-2019), 8 kept constant shares and only 3 (namely, Chinese Taipei, Korea, and Chile) increased their education expenditure shares.
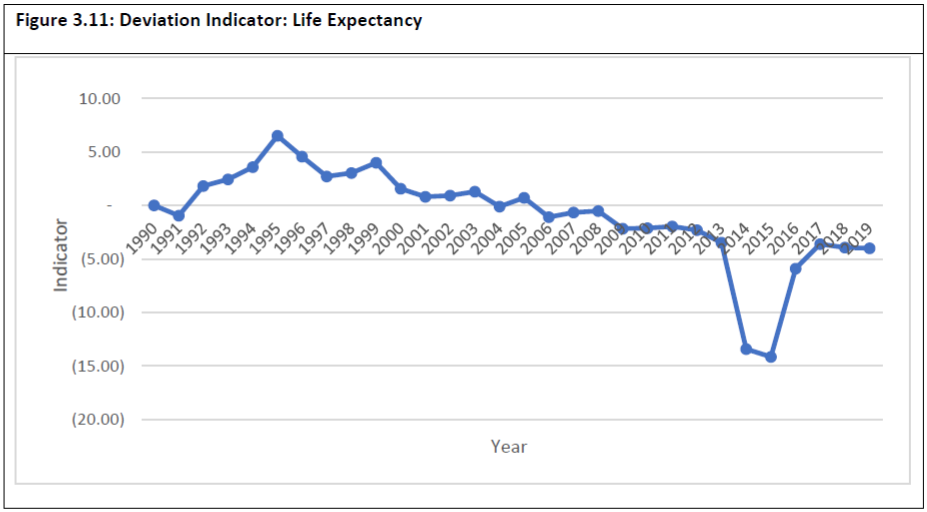
In 1990, the average life expectancy in the region was 73.6 years with a standard deviation of 3.52. After 20 years of development, in 2019 it had increased by almost 5.6 years to 79.19, with a standard deviation of 3.66. As seen in Figure 3.11, the life expectancy among Asia Pacific economies exhibited the most uneven distribution in 2016. Though it become less so during 2017-2019, the overall discrepancy still remains larger than its initial level in 1990. This means life expectancy is increasing faster in certain economies than others.
When APEC leaders set out the Bogor Goals in 1994, they set out a vision through which the region would not only maintain high growth rates but also narrow development gaps. While the region has done well in integrating and overall incomes have increased at a dramatic pace, the index shows that there is a long way to go in terms of closing development gaps. Integration is not an end in itself but a means to ensuring that all citizens can achieve their potentials. Many negative shocks, such as the Asian Financial Crisis, the Global Financial Crisis, the US-China trade war and the pandemic significantly disrupt the efforts of achieving a more integrated economy in Asia Pacific region. However, the agreements on CPTPP in 2017 and RCEP in 2020 bring us hopes that more liberalized flows of goods and productive factors will effectively maintain and accelerate to integration process.
<< Previous
Next >>