CHAPTER 1: ASIA-PACIFIC OUTLOOK
While global economic growth is expected to decelerate by 0.6 percentage points from 3.4 percent in 2022 to 2.8 percent this year, the Asia-Pacific is expected to buck this trend with growth accelerating from 2.7 to 2.9 percent this year. However, prospects remain fragile, with lower growth expected over the medium term compared to previous expectations. APEC, the region’s premier economic forum has set out to address an ambitious agenda in 2023 of “Creating a Resilient and Sustainable Future for All”, with priorities focused on:
- Building a resilient and interconnected region that advances broad-based economic prosperity.
- Enabling an innovative environment for a sustainable future; and
- Affirming an equitable and inclusive future for all.
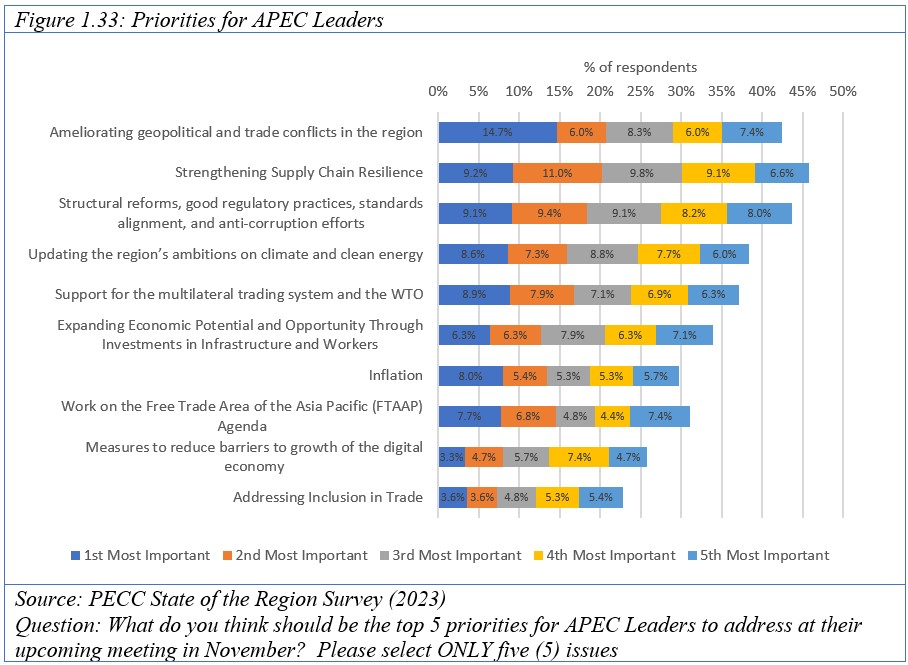
The Pacific Economic Cooperation Council’s survey of regional stakeholders undertaken at the end of the first quarter of 2023 shows broad support for these priorities. The top issue stakeholders thought APEC Leaders’ should discuss at their meeting in November in San Francisco was “Ameliorating geopolitical and trade conflicts in the region” which was followed by:
- Strengthening Supply Chain Resilience
- Structural reforms, good regulatory practices, standards alignment, and anti-corruption efforts
- Updating the region’s ambitions on climate and clean energy
- Support for the multilateral trading system and the WTO
The first focus area “Interconnected” includes addressing Strengthening Supply Chain Resilience; and Support for the WTO which were among the top 5 issues stakeholders thought should be addressed but also implementation of APEC’s work on the Free Trade Area of the Asia-Pacific and promoting digital trade which were 8th and 9th highest priorities.
APEC’s second focus area “Innovative” includes enhancing climate mitigation and resilience; tackling environmental challenges; and fostering an enabling environment. Stakeholders selected structural reforms and good regulatory practices as the 3rd highest priority and work on climate as the 4th highest.
The third focus area “Inclusive” among others includes addressing inclusion in trade and expanding economic potential and opportunity through investments in infrastructure and workers which were 6th and 10th highest in stakeholders list of priorities.
Another of APEC’s priorities this year is expanding stakeholder engagement in trade and trade policy. While above 50 percent of respondents thought that government regular consultation with businesses and legislators was ‘just right’, around a quarter or less of respondents thought that other stakeholders ranging from academics and research institutions through to civil society and organized labor was sufficient. Moreover, the survey results indicate a perception that the mechanisms for consultations with stakeholders on trade policy and trade agreements tend to be more exclusive, with 55 percent saying that consultations with trusted advisors took place on a frequent basis but again, less than a quarter of respondents think that more inclusive processes such as open forums and public submissions take place often. These findings support the need for deeper and broader stakeholder engagement as instructed by APEC Leaders’ in the Aotearoa Plan of Action adopted in 2021.
Respondents again selected ameliorating geopolitical and trade conflicts as the top priority for Leaders’ discussions this November. This follows from previous years’ results when similar issues received the same level of priority. It also echoes concerns about the risks that geo-economic fragmentation poses to economic growth. Stakeholders clearly believe there is a role for APEC to play in ameliorating these tensions. As a non-binding economic forum, APEC has the ability to focus on issues critical to the development of the region and allow technical discussions to proceed that impact the everyday lives of citizens. The increased levels of tensions increase uncertainty and put a higher risk premium on the investments needed to address climate change and addressing inequality - economic; social and financial both within among regional economies.
The Regional Economic Outlook
The update to the economic outlook for the Asia-Pacific shows a slight upgrade in forecasts for growth this year from 2.5 percent last October to 2.9 percent in April.[1] While out of the 27 economies covered in this report, growth for 16 of them has been downgraded from October, the same for 3, and upgraded for 8. Upgrades to growth for China and the United States which combined account for over 64 percent of the regional economy in current US dollar terms have helped to push the expected growth for the region in 2023 higher than it was just 6 months ago. The overall outlook for the region’s two largest economies should help to pull other economies up, but uncertainties over the economic outlook, high inflation and rising interest rates remain drags on growth.
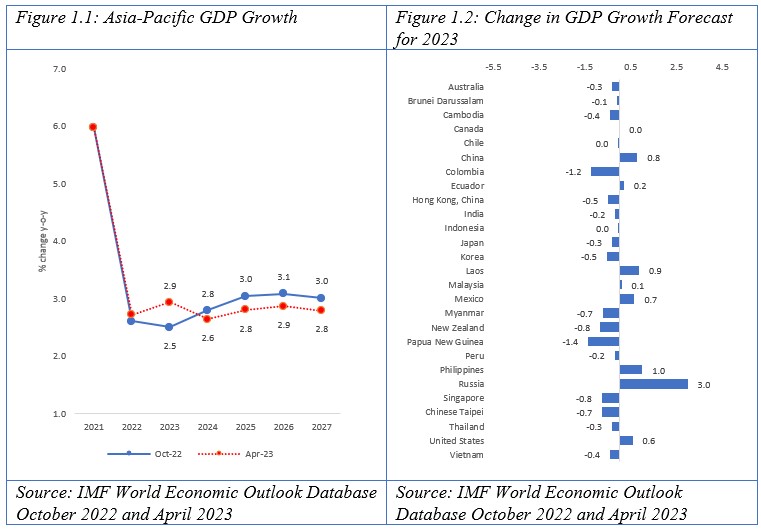
Even more worrying for the region is that economic growth over the next four years is now expected to be weaker than forecast in 2022 by about 0.2 percentage points. While this may seem like a small amount, it is an accumulated loss of anticipated output of around US$665 billion dollars.
These concerns are reflected in respondents to PECC’s State of the Region survey conducted from 23 March to 28 April 2023. Out of the 728 respondents, 47 percent expected weaker growth for the global economy, but 33 percent expected slower growth for their own economies. As shown in Figure 1.3, expectations for growth of the world economy have slightly improved from last year when 60 percent expected weaker growth and only 17 percent stronger. The balance thought growth would be about the same as the previous year.
Comparing Figure 1.3 and Figure 1.4, respondents tended to be much more pessimistic about growth prospects for the global economy with 47 percent expecting weaker and only 14 percent stronger growth compared to prospects for their own economies with 33 percent expecting weaker growth and 31 percent stronger growth.
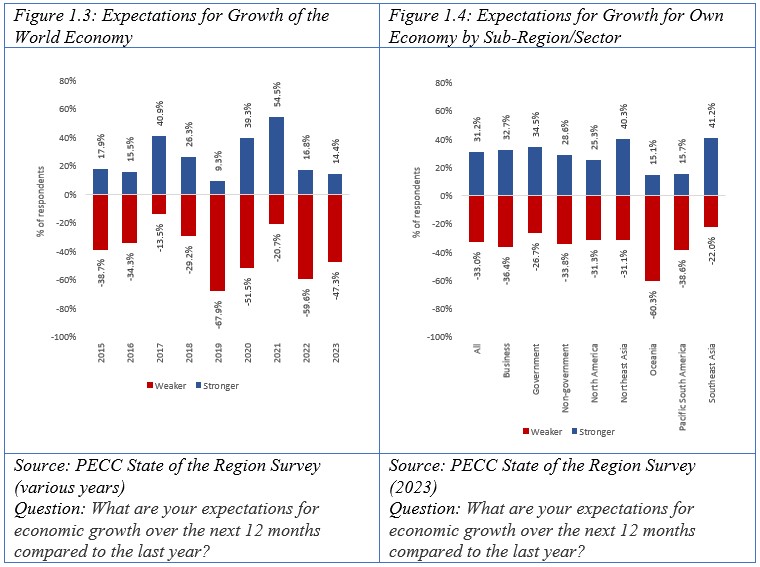
Business respondents tended to be the most pessimistic with 36 percent expecting weaker growth, compared to 27 percent and 34 percent for government and non-government respondents respectively. However, the differences among stakeholders were relatively small when compared to responses by sub-region. Respondents from Oceania were far more pessimistic about the growth of their own economies compared to other sub-regions, with 60 percent expecting weaker growth and only 15 percent stronger.
These perceptions of prospects for economic growth are likely to weigh heavily on decision-making with respect to investment and consumption, which in turn will lead to lower growth for the region. To head off a strong downturn in growth, it is important for policy-makers to understand what lies behind these pessimistic expectations.
Risks to Growth
The economic headwinds the region and the world are facing are considerable. Figure 1.5 shows respondents views on what they see as the top risks to growth for their economies. The values on the horizontal axis are percentage of respondents; the values on the vertical axis are the seriousness of the risk, while the bubble size a combination of both frequency and seriousness. The frequency of a risk being selected is interpreted here as the likelihood of the materialization of the risk.
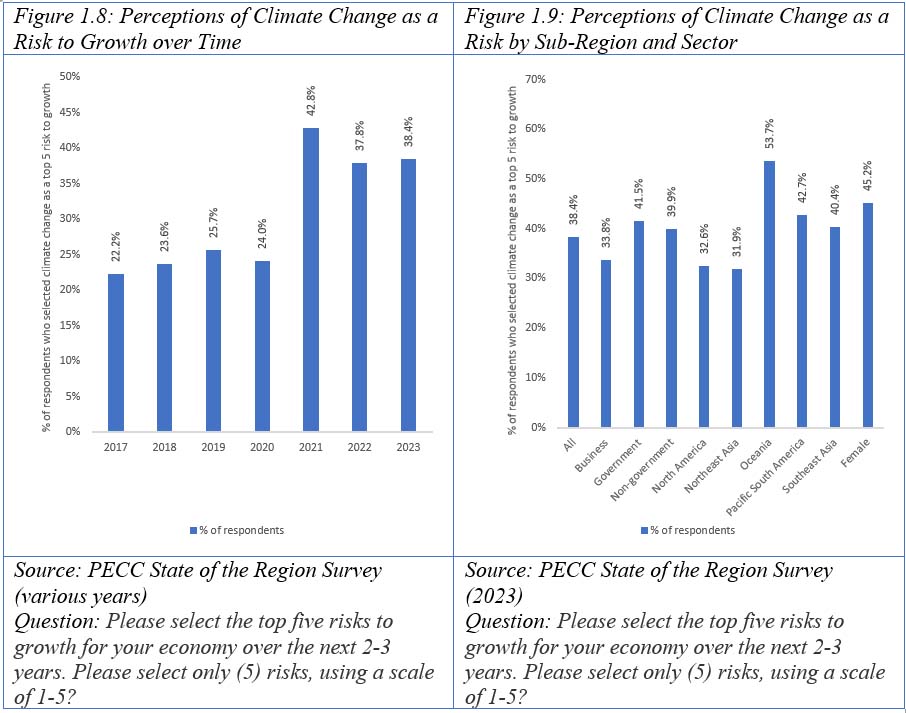
The rising cost of living was followed by climate change and geo-economic fragmentation, although as shown in the chart, a higher percentage of respondents found climate change as a risk while respondents gave a higher score to the seriousness of risk of geo-economic fragmentation, which may reflect the latter being a nearer term. The elevated concerns over the risk that climate change may create for economic growth continues a trend which started in 2020.
While all stakeholders regarded the rising cost of living as the biggest risk to growth, there were differences on the 2nd most important risk, with business respondents selecting a “slowdown in world trade growth,” which was 5th and 6th for non-government and government respondents respectively. There was also divergence on perceptions of the impact of geo-economic fragmentation on economic growth with non-government actors and business respondents ranking it as the 2nd and 3rd highest risks.

Rising Cost of Living
The rising cost of living stood out considerably as the top risk to growth, continuing concerns over inflation. At the same time, however, respondents were somewhat less concerned about the possibility of a wage-price spiral. Average consumer prices in the Asia-Pacific region increased by 5.6 percent, a more than 20 year high last year, however, they are expected to moderate to a 3.8 percent increase this year and then come down to about 2.3 percent as shown in Figure 1.6.

However, uncertainty remains over the trajectory of consumer food price inflation. As shown in Figure 1.7 there was a month-on-month increase of consumer food prices in the region, even as food input prices moderated. Prices for key agricultural commodities, such as rice, remain elevated. This is especially of concern to lower-income families who spend a much higher percentage of income on food.
Climate Change as a Risk to Growth
As noted earlier, concerns remain elevated over the risk that climate variability poses to overall economic growth, however, business respondents were considerably less concerned about its impact on economic growth. This may reflect a belief that there are also significant business opportunities associated with the phenomenon.
While projected impacts vary by location, the overall costs of climate change include:
- Lower productivity and agricultural yields;
- More frequent catastrophic events (droughts, storms) disrupt economic activity and cause greater physical destruction of productive capital, infrastructure; and
- Deterioration of health and possible loss of life due to natural disasters and increased prevalence of infectious diseases;
- Diversion of resources toward adaptation and reconstruction [2]
As shown in Figure 1.9 while close to 42 percent of government officials considered climate change a top risk to growth, only 34 percent of businesses did. An even larger difference of views was seen among sub-regions with 54 percent of those from Oceania regarding it as a top risk as opposed to only 32 percent of those from Northeast Asia.
There are only three other issues where government and business perceptions of risk diverge to such an extent: food security; shortage of available talent/skills; and a possible wage-price spiral. While food security and a wage price spiral are not on the top 10 list, 18 percent more government than business respondents selected it as a top risk.
Importantly while the rising cost of living was by far the top risk to growth with 52 percent respondents selecting it as a top 5 risk to growth, only 16 percent of respondents selected a wage-price spiral as a risk to growth. However, 21 percent of business respondents did select it as a risk.
Geo-Economic Fragmentation as Risk to Growth
The second highest risk to growth this year was geo-economic fragmentation, although slightly fewer respondents selected it as a top 5 risk than those who selected climate change, respondents who selected it as a risk to growth ascribed a higher degree of seriousness to its impact, than those who selected climate change. Considerable differences were evident among respondents on their perceptions of the risk it poses to economic growth, with 46 percent of non-government stakeholders the most concerned, 30 percent of government officials, and businesses in-between at 36 percent. Overall, the percentage of respondents who selected geo-economic fragmentation as a risk increased from last year by 4.6 percentage points – worrying for a region that has benefitted so much from integration. As discussed in last year’s report, the costs of fragmentation are considerable, with the IMF’s compilation of research placing the cost at between 0.2 to 7 percent in its most severe case, but with some economies seeing losses of 12 percent if technology is added.
Slowing Trade and Increased Protectionism
Connected to concerns over economic fragmentation are increased protectionism and trade wars and slowing global trade. As shown in Figure 1.10, concerns over increased protectionism are fairly equally shared among stakeholders at around 35 percent, but there are bigger differences at the sub-regional level with about 41 percent of North Americans and Northeast Asians selecting it as a top risk but Southeast Asians and those from Pacific South America less concerned at about 29 percent. Respondents from Oceania were between these two groups at 39 percent.
Overall respondents were slightly more concerned over slower world trade growth at 40 percent, with some significant differences among sectors, 43 percent of businesses selecting it as a top risk to growth compared to 38 percent of government and non-governmental respondents. Differences were larger at the sub-regional level with Northeast and Southeast Asian respondents the most concerned at over 40 percent, compared to under 28 percent of respondents form North and Pacific South America.

There seems to be a disconnect among sub-regions most concerned about increased protectionism and those most concerned about slowing trade growth. For example, while North American respondents were very concerned over increased protectionism, they were less concerned (comparatively) about a slowdown in trade growth. Conversely, respondents from Southeast Asia were very concerned about a slowdown in trade growth but less so about increased protectionism. It begs the question of whether respondents see a causal relationship between the two or if different groupings see themselves affected differently, ie some sub-regions that rely less on international trade as a driver of growth are less likely to be impacted by slower trade. These are difficult questions to answer that require deeper research and consultation among stakeholders.
Figure 1.11 shows the results of the State of the Region over time on the two issues, two observations can be made from this:
1) There is a connection between how respondents see rising protectionism and concerns over slowing world trade growth; and
2) Concerns over the two are elevated though not at their highest levels over the period.
Over the past twenty years there has been a gradual slowing of trade growth in the region. Concerns over slowing trade growth are justified, as shown in Figure 1.12, trade in the region was growing at an average of around 8.2 percent before the Global Financial Crisis, after 2010 it slowed to 5.2 percent and over the post pandemic period it is expected to be at around 4.4 percent.

Protectionism as a risk to growth has been an option in the survey since 2010 in the aftermath of the Global Financial Crisis and concerns at that time were less about overt actions if not trade wars but what was then described as ‘creeping protectionism’[3] while slower global trade growth was introduced as an option in 2016 as anxiety over ‘slowbalization’ increased. [4] As shown in Figure 1.13 the number of trade restricting acts implemented by regional economies ballooned during the post-Global Financial Crisis period and again during the pandemic. This is in spite of APEC and G20 leaders efforts to constrain protectionist behavior with hard negotiated language such as that at the G20 Leaders’ meeting in Pittsburgh: “We will keep markets open and free and reaffirm the commitments made in Washington and London: to refrain from raising barriers or imposing new barriers to investment or to trade in goods and services, imposing new export restrictions or implementing World Trade Organization (WTO) inconsistent measures to stimulate exports and commit to rectify such measures as they arise.” It is important to remember the context in which such normative statements were agreed – a fear of the crisis resulting in a long and deep economic recession such as the Great Depression in the 1930s when tit-for-tat trade policy responses exacerbated an already difficult situation.
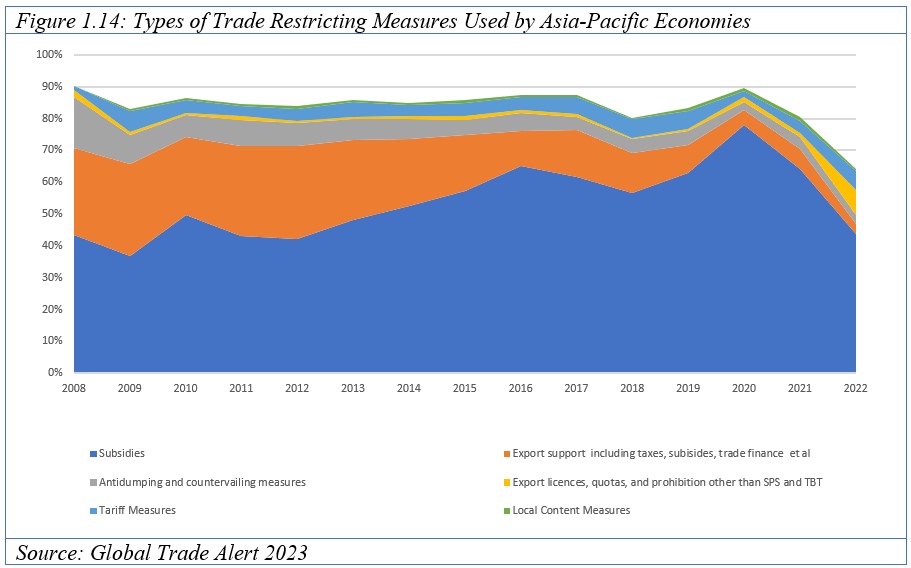
An important question is what are the types of measures governments have been using over this period? As shown in Figure 1.14, by far subsidies account for the highest number of measures at 57 percent over the whole period. While a total of 22 measures are included, the 6 types here account for over 80 percent used, However, as shown in the chart, these accounted for only 64 percent of all measures in 2022, with other policies being used such as government procurement procedures, prohibitions other than for SPS and TBT reasons, and capital controls.
Where do Perceptions of Risk Diverge the Most?
The remaining top risks to growth were:
- Rising global interest rates;
- Ukraine Conflict;
- Failure to implement structural reforms;
- Shortage of available talent/skills; and
- Energy security
On these issues there were considerable divergences at the sectoral and sub-regional levels. Among different stakeholder groups, the issues on which stakeholders diverged the most were:
- Climate change;
- Food security;
- Geo-economic fragmentation;
- Shortage of available talent/skills; and
- Wage-Price Spiral
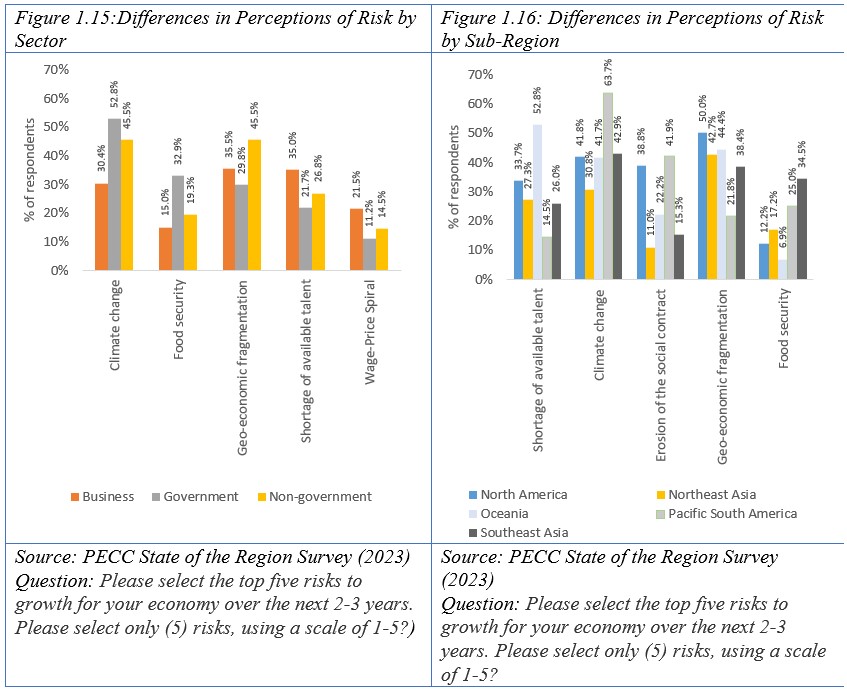
As discussed above and shown in Figure 1.15 there was a significant difference in perceptions among stakeholders on the risk climate change poses to economic growth with a gap of 22 percent. The issues that next most divided stakeholders were food security and geo-economic fragmentation. Government respondents were far more concerned about food security compared to business and non-government. Views were spread out on geo-economic fragmentation with non-government respondents the most concerned followed by business and then government.
The next was shortage of available talent/skills with considerably more business respondents selecting it as a risk compared to government counterparts. The final issue on which stakeholders’ perception of risk differed was a wage-price spiral with 22 percent of businesses selecting it as a risk compared to 11 percent of government respondents. The difference in perceptions related to 2 important labor market issues should be a wake-up call to policy-makers. Across different markets unemployment is at low levels likely to result in considerable pressure to increase wages. Research by the IMF suggests that wage-price spirals remain contained.[5] Moreover, they suggest that nominal wage growth lags behind inflation.[6] While attention is focused on wages and general price increases, a bigger concern is whether or not wages have kept up with inflation in recent years. As argued in the 2021 State of the Region report, the risks of a K-shape recovery were large with some sectors of the economy not recovering as quickly as others resulting in even greater inequality. Moreover, this is a historic trend with a decoupling of wages from productivity growth. [7] These issues are further discussed in the next section of this report.
Looking at differences at the sub-regional level, with the exception of the erosion of the social contract, the issues on which respondents differed the most were the same as those at the sectoral level. However, respondents’ perceptions of risk at the sub-regional level differed from those at the sectoral level as well as in magnitude, see Figure 1.16.
Sub-regions differed the most on how much threat a shortage of talent/skills may pose to economic growth. A very high 53 percent of respondents from Oceania selected it as a risk to growth compared to just 15 percent in Pacific South America. This placed a shortage of talent as the top risk for Oceania just a little above the rising cost of living. Whereas only 14.5 percent of respondents from Pacific South America selected a shortage of skills as a risk, making it only the 15th most selected risk for them. This kind of difference is natural given the different stages of development that economies in the region are at as well as their current demographic profile. Demographic transformations, widening differences in levels of economic and educational development and continued regionalization and globalization of industry, all suggest that Asia-Pacific economies will almost certainly require ever greater international movements of labor in the future.[8] However, the lack of mechanisms for managing such flows especially as skills shortages become more acute remain a problem for the region and the world.
There was a similarly large gap in perception between sub-regions on the risk of climate change, with those from Pacific South America the most concerned at 64 percent and Northeast Asia the least at 31 percent. However, even though a considerably smaller share of Northeast Asians selected climate change as a top issue, it was still considered a top 10 risk by them.
There was a maximum spread among sub-regions of around 28 percent on geo-economic fragmentation and food security. Respondents from North America were far more concerned about the risk of geo-economic fragmentation than those from Pacific South America. While for food security, the gap was largest between Southeast Asia and Oceania. With 35 percent of respondents from Southeast Asia selecting food security it was the 5th highest risk, while for Oceania with only 6.7 percent it was the second from bottom.
Interestingly, the erosion of the social contract was the 4th highest risk for Pacific South America. Respondents from North America also placed the erosion of the social contract as a high risk to growth, while those from Asia – both Northeast and Southeast Asia were much less concerned. It is important to note that the erosion of the social contract was not an issue on which stakeholders differed that much with a range of just 2.8 percent compared to the 30.9 percent range among sub-regions. Instead, as discussed above, stakeholders differed more on the risk of a wage-price spiral, but even then, the range was 10.3 percent. However, research suggests that there are connections between the two. For example, while work (and employment) opportunities have increased, job security and income growth have declined and even as consumers benefit from lower prices for goods and services, rising costs for housing, healthcare and education have absorbed between 54 and 107 percent of income gains in some cases.[9]
Perceptions of the Inclusiveness of the Economic Recovery
As important as the recovery is, just as important is the quality of growth as the region and the world emerge from the pandemic. Perceptions of how inclusive that recovery has been are less than satisfactory with only 7.5 percent of respondents saying that the recovery has been extremely inclusive and 12.3 percent that it has been not at all. Given that in 2021 regional leaders set out their ambition to ‘target measures where they are needed to facilitate job creation and inclusive economic recovery, including actions that enable women to participate fully in the recovery’ this should raise concerns on the general trajectory of growth in the post-pandemic period. [10]
While the vast majority of respondents believe that the recovery from the pandemic has been moderately inclusive, there were important differences in perceptions depending on sub-region and gender. Looking at responses through a gender lens, views were complex, 4.3 percent more women than men thought the recovery was extremely inclusive, 5.3 percent more women also thought the recovery was not at all inclusive. Far fewer women selected the ‘middle option’ of a moderate level of inclusiveness.
The percentage of respondents who thought that the recovery was extremely inclusive by sub-region ranged from just 2 percent in North America to 10.2 percent in Southeast Asia. At the same time, Southeast Asians were least likely to say the recovery was not at all inclusive at 11.9 percent but it was respondents from Pacific South America who were the most negative about the recovery with 16.3 percent of respondents saying it was not at all inclusive (see Figure 1.17 below).

Problems with the inclusiveness of the recovery are further demonstrated in Figure 1.18, The differences in gender perception become evident when asked ‘which sectors have lagged behind’, 31 percent of respondents selecting women, however, with a much higher 41 percent of female respondents selecting this compared to 27 percent of males. One additional observation based on the survey data is that female respondents were more likely to select any of the 12 options as a lagging sector compared to males, with the exception of MSMEs, manufacturing and unionized labor.
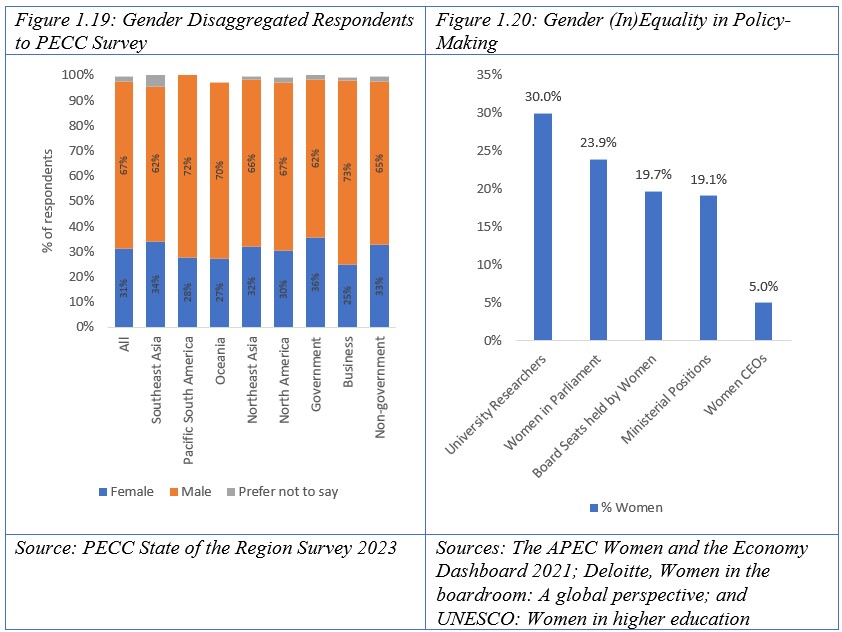
As shown in Figure 1.19, respondents who identified as female accounted for just 31 percent, while males were 67 percent, the balance preferred to not answer or were non-binary. Those numbers varied by sub-region with Southeast Asia having the most female respondents at 34 percent, and by sector with government the most at 36 percent. Given that females accounted for just under a third of respondents, increases the need for gender disaggregated data or at least an equal weighting of views not only in surveys but also decision-making on priorities. The lower representation of women in this survey generally reflects similar situations in decision-making positions. As shown in Figure 1.20, the percentage of women key decision-making roles across all sectors remains even lower than the 31 percent represented in this survey, for example, ranging from a lowly 5 percent of CEOs, to 30 percent of university researchers. Currently, women account for 19 percent of ministerial positions globally about 19.7 percent of board seats. In the region, this drops to an average of about 7.6 percent of board seats held by women.[11] That lack of ‘balance’ may well result in the pursuit of very different policy agenda than if there was more equality of ‘voice’ representation at all levels. (See below).
Worryingly for APEC which emphasizes inclusive growth, with a particular focus on micro and small and medium enterprises (MSMEs), 59 percent of respondents overall thought that this sector had lagged behind. Respondents from all sub-regions, sectors, and gender selected MSMEs as a group that had lagged behind. One area where progress could be made is in MSME participation in trade. According to data from the WTO, being small (or even micro) has not impeded firms in some economies from trading with MSMEs being the largest number of exporting firms but still a relatively low share of the total value of trade. [12]
The second-most sector respondents picked out as lagging behind was the informal sector. According to the IMF “the prevalence of informal work is also associated with high inequality: workers with similar skills tend to earn less in the informal sector than their formal sector peers, and the wage gap between formal and informal workers is higher at lower skill levels.”[13]
This was followed by elderly and then youth, ethnic minorities after which came women. Among different types of economic activity, the services sector was selected by more respondents than manufacturing and agriculture as a sector that has lagged behind. This should not be surprising given the extent to which the measures to prevent the spread of Covid-19 affected sectors characterized by human interaction, but also has implications for other groups such as women and youth that tend to be disproportionately employed in these sectors as well as a large number of informal employees.

Respondents were also asked about the impact of different issues on inequality shown in Figure 1.21 above. One caveat here is that the question did not specify the direction of the impact – whether it increased or decreased inequality. However, generally the question was interpreted as to whether they increased inequality.
Two issues stood out:
- Education system not preparing people for real jobs; and
- Rapid Technological Change
Over 50 percent of respondents thought that these had a major impact on inequality. The two are deeply inter-related. New technologies lead to labor-saving ways to do things, but they also usually make some jobs obsolete. It is not only the level of productivity gains and the extent of displacement that matter, but also how these are distributed, their timing and their longer term economic and social impacts.[14] An earlier PECC survey found that skill shortages and skill surpluses are expected to coexist which is likely to be a defining feature of the Fourth Industrial Revolution , “there is no reason why we should be assuming that displaced workers would be readily employable to any of the newly created technologically advanced jobs. Mismatch will play a large role in the labor markets of the future and we already see substantial differences by geography and by occupation.”
There were also significant differences among sub-regions on these issues, which underscores the importance of building a deeper understanding of not only perceptions but the course of action recommended. For example, on the role of education in preparing a future work force, the need for lifelong education and the distribution of the costs of paying for it.
Historically, new technologies have brought large net material gains and changed many lives and livelihoods. In the process, many workers lost their jobs, experienced lower lifetime incomes and in many instances completely changed the direction or even ended their working lives. Also, historically, technological change has in many instances created rather mixed outcomes with winners and losers, where losses often remained uncompensated. That is, losses suffered by displaced workers and specific communities that were not compensated by those other workers and communities that gained from the new technology. The overall impacts from past industrial revolutions (that is, both gains and losses) often took long to be realized and the benefits and losses were often unequally distributed. Evidence thus far is mixed, to date there has been little evidence of widespread job losses. In a 2018 PECC survey 15 percent of respondents expected job losses in the retail sector[15], however, 5 years on, sectors such as retail have not seen job losses but they have shifted from bricks-and-mortar to e-commerce operations. [16] The problem in today’s world is the rapidity of change. Figure 1.22 shows how many days a technology took to reach 50 million users, this chart used to be presented in years, with the telephone taking 75 years, the last in the list to be measured in years is WeChat at just one year, but ChatGPT, the artificial intelligence Chatbot reached 100 million users in just 2 months. Apps like Pokémon Go have reached a mass audience in just 19 days. Preparing the work force for this world is likely to be massive challenge with 85 percent of the jobs of 2030 not yet in existence. [17]
That 52 percent of respondents believe that the education system does not prepare people for real jobs is a striking result. Deep debates exist on the nature of education – knowledge transfer, incorporating innovative thinking, and problem solving. In looking at the future of skills and jobs the argument was made that “managing the transition from the education system to employment is not a matter of learning specific skills. It is mostly a matter of developing knowledge and aptitudes as defined in the core competencies. One of our problems is that many teachers have little knowledge of any employment other than their own and it is not easy for many parents to provide it. That is a challenge for business - make employment comprehensible and attractive.’ Various studies on education provide results that counter often made assumptions about how to improve education in schools, for example a randomized test on whether children that were given a computer did better or not, and far from improving achievement or cognitive skills children that received them were less likely to make an effort. While controversial approaches such as ‘streaming’ increased future annual earnings by as much as 8 percent.[18]
APEC’s 2016-2030 Education Strategy argues that “iinvestment in education and training, regardless of gender, race, religion, or ethnic background increases the speed with which an economy develops and adopts innovative technologies, accelerates employment growth and moves economies towards more complex and value adding industries.”[19] A key question is how much investment and on what? In reviewing the Sustainable Development Goals, progress on them and how to focus efforts, one study found that spending an additional US$9.8 billion a year on education would lead to a US$604 billion annual boost to lifetime income. [20]

While concerns over employment, education and technology are valid, for example the OECD estimates that 14% of jobs are at high risk of automation, instead of seeing rising unemployment in recent years, there has been rising employment, with economies that have invested more in technology experiencing higher employment growth.[21] Focus needs to be on dealing with the structural changes likely to take place with this change including through active labor market policies, and lifelong learning.
Rapid technological change and education problems were followed by a lack of social safety nets. A high 43 percent thought this had a major impact while 16 percent thought they had no impact on inequality. More work needs to be done to understand the role that social safety nets can play to strengthen social cohesion. Sustainable Development Goal 1.3 call for appropriate social protection systems and measures for all, including floor level support, and by 2030 achieving substantial coverage of the poor and the vulnerable. As with responses to most of the questions in this survey, the differences among sub-regions tended to be larger than those among sectors, however, opinions on the role of the lack of social protection varied significantly. While 52.1 percent of government respondents thought that their lack had a major impact on inequality (followed by non-government at 47 percent), only 30 percent of business respondents agreed. As shown in Figure 1.23 total expenditure on social protection as a percentage of GDP varies considerably, even amongst OECD members for whom data is available. The OECD average is 23.2 percent of GDP but the division between public and private social spending also varies with the high for private spending as much as 12.5 percent of GDP, but others less than 1 percent. Another factor is how social expenditure is used. For example, income support accounts for, on average, 3.6 percent of GDP, while pensions are much higher at 7.7 percent of GDP. A key question given ageing populations in many economies is whether current funding models are sufficient for future needs. Given adjustments to changes in the structure of the work force; more funding may be needed for income support as the transition to new jobs is made.
An earlier study of social safety nets in the region, undertaken in light of the two major economic crises, came to the conclusion that social safety nets such as unemployment insurance can be introduced at lower levels of development. Furthermore, the period of recovery from an economic crisis is a good time to introduce unemployment insurance or improve existing plans as people and politicians have vivid memories of the social pain. In looking through the correlates of the introduction of social safety nets, the experts found that there was not a clear relationship between social safety nets and saving rates but that their introduction would obviate the need for households to worry excessively about unexpected contingencies and retirement, thereby enhancing household welfare. They suggest that a two-pronged approach of simultaneously developing social safety nets and private capital markets may be the most effective way to enhance household consumption and welfare.[22]
Respondents generally regarded the remaining four issues: over-regulation of businesses; trade with other economies; discrimination against specific groups on the grounds of gender, ethnicity etc; and under regulation of the businesses as having only a moderate impact on inequality.
Looking at the views of different stakeholders and sub-regions provides a more nuanced picture of the results but understanding the underlying drivers of these perceptions requires more factual and scientific research.
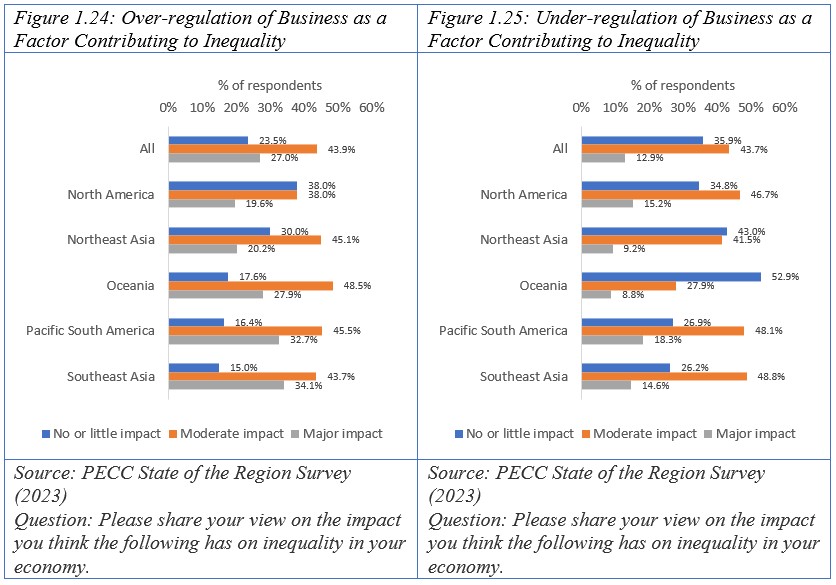
Two points emerge from the deeper dive into the survey findings shown in Figure 1.24 and Figure 1.25:
1) Respondents did not necessarily see over and under-regulation as mutually exclusive options. In about 53 percent of responses, respondents gave the same evaluation to over and under-regulation. To put it more clearly, some respondents said that both over and under regulation had a major impact in inequality.
2) While the largest group of respondents were those who thought they had a moderate impact, there were differences on among sub-regions, for example considerably more respondents from Southeast Asia and Pacific South America thought that over regulation had a major impact. While considerably more North Americans, Northeast Asians and even more those from Oceania thought that the under-regulation had much less of an impact.
The question is therefore not of over or under-regulation but one of regulatory quality which is likely to vary strongly by sector. APEC has a substantive structural reforms agenda under which work on regulatory policies take place. Now in its 4th iteration, the Enhanced APEC Agenda for Structural Reform (EAASR) has the following pillars:
- Creating an enabling environment for open, transparent, and competitive markets;
- Boosting business recovery and resilience against future shocks;
- Ensuring that all groups in society have equal access to opportunities for more inclusive, sustainable growth, and greater well-being; and
- Harnessing innovation, new technology, and skills development to boost productivity and digitalization.
The action agenda encourages APEC members to adopt three approaches to promote structural reforms for inclusive growth:
- Work on competition policy and law; strengthening economic and legal infrastructure; ease of doing business; regulatory reform; public sector governance; corporate law and governance to improve market functioning and transparency;
- Implementing specific market reforms to improve innovation and competitiveness of business and achieve pro-inclusion benefits; and
- Adopting a holistic approach to structural reform which combines core reforms, specific market reforms and broader policies to boost productivity and economic resilience.
Emphasis is placed on removing structural barriers to accessing economic opportunities, something that needs equal attention if inclusion is to be addressed. In 2015, APEC’s Structural Reform Ministers emphasized that “[W]hile absolute poverty has fallen and average income per capita has increased in the APEC region, growth in some cases has widened income disparities between the rich and poor. The benefits of rapid economic growth have been unevenly shared both across and within individual APEC economies. We note that there are groups (e.g. women, older workers and minorities), firms (e.g. micro, small and medium enterprises (MSMEs)) and regions that have benefited proportionately less from economic growth and globalization.”
Over the 2007-2021 period punctuated by two major economic crises, inequality in the region has increased significantly. Figure 1.26 shows the change in the income share of the population in the Asia-Pacific (weighted by population). The share of the top 10 of the population in the region increased from 44.7 percent to 45.5 percent, while the income share of the bottom 50 percent declined from 13.9 percent to 13.7 percent.
Levels of wealth inequality have increased even more dramatically with the top 10 percent’s share of wealth increasing by more than 5 percentage points from 62.5 percent to 67.7 percent and the bottom 50 percent decreasing from 5.8 percent to 4.6 percent shown in Figure 1.27. Just as concerning is the regressing of the middle 40 percent whose share of both income and wealth has also declined.
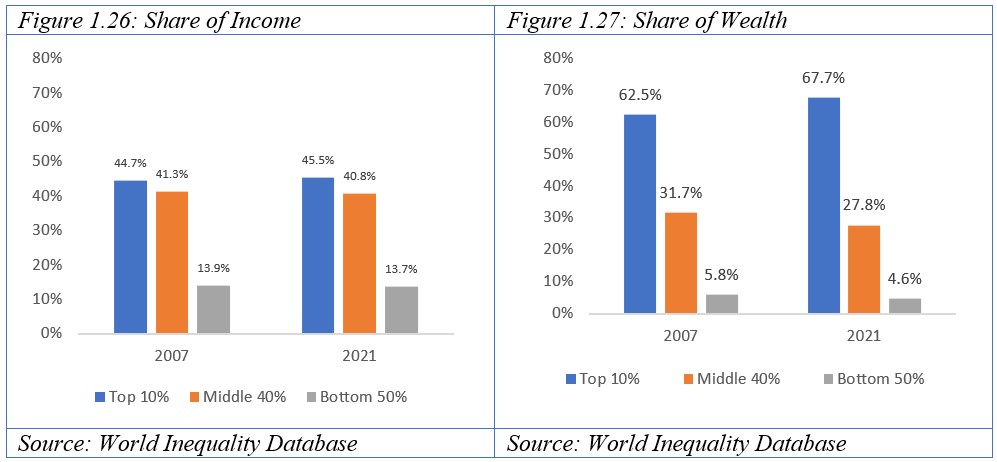
While the magnitude of the changes may seem small, the APEC Policy Support Unit estimates that from 2015- 2018: while the poorest 5% of the population gained 0.3% of the increase in aggregate income during this period, the richest 5% gained 14.0%. [23] They further argue that labor market policies such as minimum wage laws, employment protection legislation, unemployment insurance system, labor unions, and active labor market policies help ensure economic efficiency as well as fairness.
An Inclusive Growth Agenda
Given both the rise in inequality over recent years as well as the goal of the region to promote more inclusive growth, respondents were also asked to share their views on the importance of a range of policies to promote more inclusive growth. As shown in Figure 1.28, all of the options presented were considered important by respondents, while the survey results disaggregated at the sectoral and sub-regional level showed a much more significant range of views by sub-region than by sector.
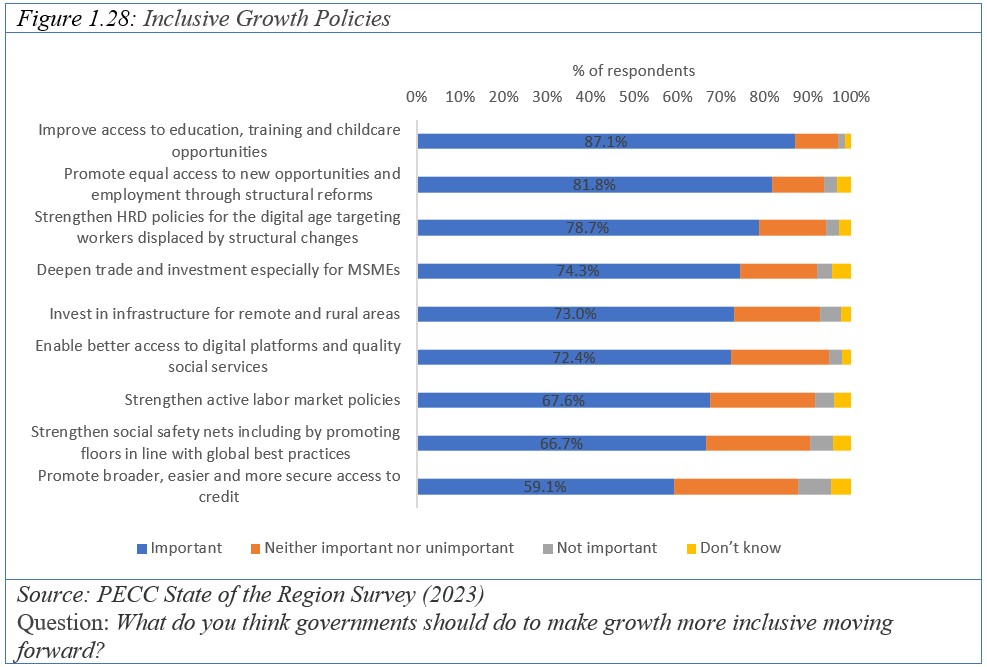
The sub-region which selected improved access to education, training and childcare the least was Northeast Asia while the highest was Southeast Asia. Government respondents placed more importance on this issue than other sectors. The role of structural reforms in this is discussed elsewhere in this report, but as with other policy options, there were considerable sub-regional differences in their relative importance in promoting inclusion, albeit with all regions seeing them as important.
The need for policies to adjust to the rapid ongoing transition through digital technologies is discussed at numerous points in this report but the responses to this question indicate a need to see issues holistically – strengthening training and openness to new opportunities for trade. The pandemic was a wake-up call to the importance of digitization. Research in Indonesia shows that 80 percent of firms that were online kept their businesses open with much of their business taking place through digital platforms with about 28 percent joining multiple platforms. [24] However, MSMEs face multiple challenges in making the transition to the digital market place, with 23 percent citing acquisition of digital knowledge/skills as the top priority for them. At the same time 83 percent of Indian SMEs cite the need to learn more about complying with digital laws and regulations.[25] Among the many policy tools at government disposal are simplifying procedures; publishing rules and regulations online, facilitating low-value shipments. If these sound familiar, many of them are already agreed to in various regional and plurilateral agreements such as the Digital Economy Partnership Agreement, the Trade Facilitation Agreement and Joint Statement on Domestic Regulations of Services to mention just a few. As for the ‘inclusion’ element, research in the US market finds that 97 percent of small businesses export if they are on a platform compared to only 1 percent of traditional businesses, moreover, while the number brick and mortar businesses in rural areas saw little growth at just 0.4 percent, those on the platform increased by almost 14 percent. [26]
Promoting broader, easier and more secure access to credit ranked lowest at 59.1 percent, but 75.9 percent of Southeast Asians thought it was important while only 39.1 percent of respondents from Oceania did so – a divergence of views of 36.8 percent. Respondents’ perceptions tend to disagree with recent analysis of the impact of financial inclusion on poverty and inequality. While studies show access to finance is positively correlated with economic growth and employment, the causal relationship between them is harder to establish, moreover, the impacts vary depending on income level. [27] Analysis of the World Bank’s Global Financial Inclusion data suggests that “financial inclusion only helps to lower poverty and income inequality when overall economic conditions empower people to use access to finance for productive purposes…Such a relationship is much more reliable in high-income economies where better policy, legal, and regulatory conditions provide an enabling environment for a range of development outcomes.” A greater proportion of respondents in emerging sub-regions selected access to credit as important for addressing income inequality.
Respondents differed the most on the importance of investments in infrastructure for remote and rural areas compared to 72.2 percent for business compared to 81 percent for government. However, the range of views among sectors on these issues was considerably narrower than those among sub-regions.
The relatively high range of importance given to different policy tools among the sub-regions suggests that for such a heterogenous region like the Asia-Pacific there is no single approach to dealing with inequality. While the relatively low range among stakeholders suggests that there is more room for convergence once those tools are selected.
While official organizations such as APEC tend to look at these issues through the prism of government policy, the survey findings suggest that a multistakeholder engagement helps build consensus.
Views on Trade
As seen in Figure 1.21, 25 percent of respondents thought that trade with other economies had a major impact on inequality and a further 47 percent thought it had a moderate impact. A slightly different question asked about the impact of trade – whether respondents thought that more open trade and investment had a negative, neutral or positive impact on their economies shown in Figure 1.29. Overwhelmingly respondents had a positive view of the impact of trade. North Americans were the most positive at 89 percent, followed closely by Oceania at 88 percent. Interestingly, while males and female respondents were very positively inclined towards the impact of trade, a significantly higher proportion of men were. The considerably large percentage of respondents who had a positive view of the impact of trade may be a reflection of fact that responses were gathered primarily through institutions that work on ‘freer trade’ and is a limited sample – those who follow Asia-Pacific cooperation issues but other, broader based surveys support this finding albeit to a lesser extent. For example, the Ipsos 2021 survey of World Opinion on Globalization and International Trade in 2021 found that 75 percent of the 19,017 respondents to their survey agreed that expanding trade was a good thing for their economy.[28] While 87 percent of the over 30,000 respondents to the Pew Global Attitudes Survey of 2018 believe that growing business and trade ties across the world is good for their economies. [29]
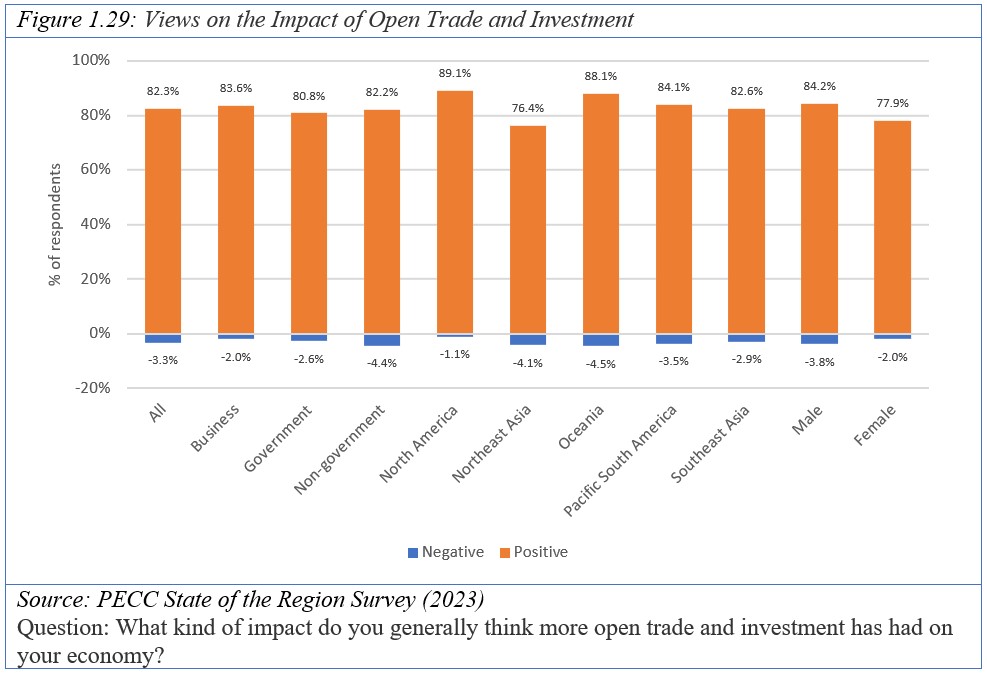
However, a significant 25 percent of respondents to the PECC 2023 survey also think that trade with other economies had a major impact on inequality – as many as those who think that it has no impact. Given that perception, more work is required to understand what lies behind that perception tools for dealing with adjustment processes related with structural changes in economies – whether brought on by policies, technological or other changes.
Making Trade Policy Work for Inclusion
As discussed earlier and seen throughout this chapter, views on issues can vary significantly by sector, gender and geographic location..
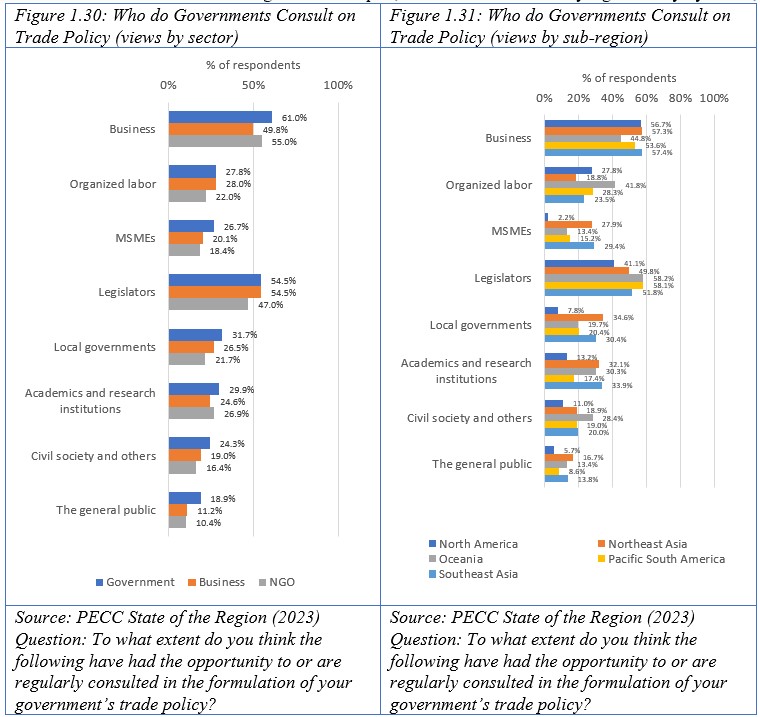
As shown in Figure 1.30 and Figure 1.31 respondents generally thought that governments tended to consult businesses and the legislative branch the most regularly in the formulation of trade policy at 55 and 51 percent selecting ‘just right’ respectively. However, after these two groups, governments were not seen as consulting any group to the same extent, academics and research institutions were seen as the next most consulted group at 27 percent, followed by local governments and organized labor both at 25 percent. Worryingly a large 35 percent of respondents thought the general public was not at all consulted regularly followed, and civil society and others at only 22 percent. A relatively large percentage selected don’t know with respect to government consultation with local governments and micro and small and medium enterprises. Ambitions to make trade policy and indeed trade more inclusive largely depend on having broad input from different groups.
As shown in Figure 1.30 more government respondents generally thought they had consultations with stakeholders just right compared to business or non-governmental respondents with the exception of organized labor. On this group, slightly more business respondents thought governments consulted with organized labor.
Interestingly, stakeholders differed the most on the extent of government consultation with business. While a large 61 percent of government officials believe that they have it ‘just right’, under 50 percent of business respondents agreed. Looking at responses by sub-region, the range of responses is a little larger, 57 percent of Southeast Asians thinking “just right,” compared to 45 percent of those from Oceania.
Views among sub-regions differed the most on the extent of MSME consultation, only 2.2 percent of respondents from North America thought it was just right compared to 29 percent of Southeast Asians. With the exception of respondents from North America and Northeast Asia, a majority of respondents in sub-regions thought that government had consultations with the legislative branch just right.
Ways of Consulting with Stakeholders
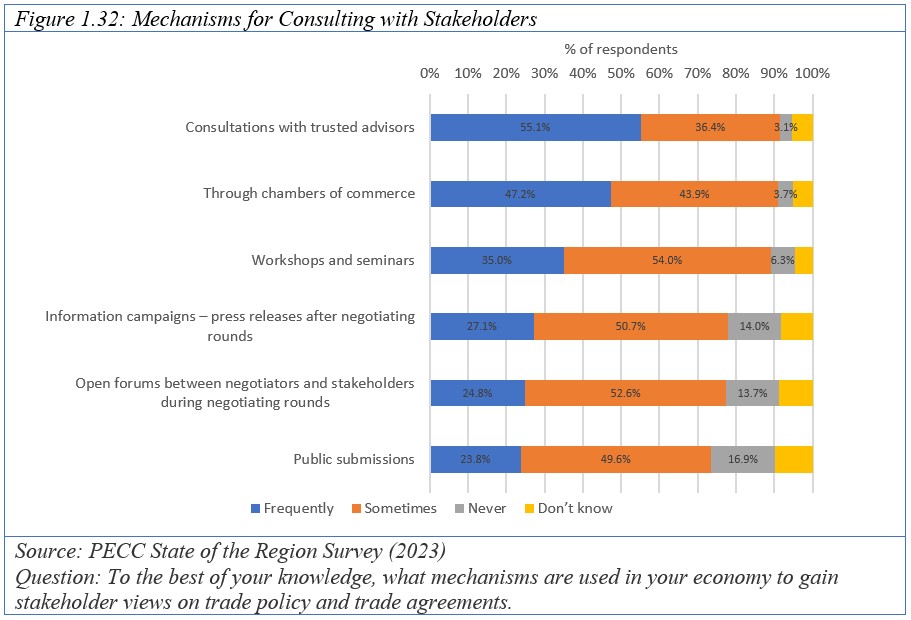
By a considerable margin, the view in the region is that the most used mechanism to gain stakeholder views is consultations with trusted advisors. Over 55 percent of respondents thought this occurred and another 36 percent said it was done sometime. A similar channel was the second most used – through chambers of commerce at 47 percent. Surprisingly a low 24 percent of respondents thought that governments used public submissions as a tool for gaining stakeholder views and a similar 25 percent open forums between negotiators and stakeholders during negotiating rounds (as occurred during the RCEP and CPTPP negotiations) were being used.
Following the previous section on which stakeholders are seen as being consulted and this section on how they are consulted, a question arises on ‘why’ and therefore what would be the most effective. Some argue that there is the need to:
- get input from stakeholders on policy choices and design; and
- enhance buy-in and assist in implementation, e[30]
Engagement with a broad set of stakeholders always help to identify and anticipate side effects and design measures to minimize them. There is also the explicit instruction from APEC Leaders in the Aotearoa Plan of Action to “[p]romote engagement with a broader range of economic stakeholders, such as NGOs and civil society, to reflect the breadth of the APEC Putrajaya Vision 2040.” APEC has a long tradition of engaging with stakeholders, with the non-governmental multistakeholder Pacific Economic Cooperation Council as an official observer since its foundation; the creation of the APEC Business Advisory Council in 1996; and various other public-private dialogue mechanisms such as the Policy Partnership on Women and the Economy; and Policy Partnership on Science, Technology and Innovation.
Whether broader consultation would make any difference, consultations with stakeholder for a recent post-hoc review of the income distribution effects of trade agreements by the US International Trade Commission suggested that ‘governments should include workers and affected communities in policy- and decision-making processes. Also, participants recommended collecting more detailed data to better understand effective policy interventions.’
It further notes that while trade and investment has benefitted ‘workers and local communities. Participants also addressed issues such as the negative impacts of job losses on local businesses, community services, and communities; difficulties that workers from underserved populations face in switching jobs; the role of unions; declines in government investment and resources; and negative perceptions of the skilled trades.’ [31]The challenges seem to be whether policy-making can ex-ante take advantage of the benefits of trade while also addressing the structural changes that take place at the community level, while for international organizations the question is what role they can place in facilitating that process.
Based on modeling simulations, the magnitudes of the adjustments of employment, which is measured in terms of the share of the labor force that needs to shift from certain sectors to other sectors, are typically estimated to be smaller than the real GDP gains as a result of the removal of tariffs and NTMs because the benefits are for the whole economy and the costs usually confined to specific sectors or areas.[32] However, those adjustments are painful and costly for individuals and communities who often face not only personal challenges but also structural barriers. Therefore, early consultations on community needs are required. Dialogue on practices to cope with these issues would be of great value, for example, APEC’s pre-existing Information Sharing Mechanism on Regional Trade Agreements (RTAs)/Free Trade Agreements (FTAs) has been used to share information among economies of recently concluded FTAs/RTAs, especially on WTO-plus aspects or aspects that are not covered by WTO.[33] Earlier exchanges included perspectives on stakeholder consultation in negotiating and implementing RTAs/FTAs. Some practices include:
- publishing a paper setting out objectives and summarizing the results of negotiating rounds; and
- Consistent dealing with requests for official information
Challenges included: the scope of negotiations; complexity of new issues, technology (social media and dissemination of misinformation); and RTA/FTA commitments (public participation, transparency clauses etc.).
Priorities for APEC Leaders
Respondents were asked to select the top 5 issues that they thought APEC Leaders should address at their meeting in November. The top 5 were:
- Ameliorating geopolitical and trade conflicts in the region;
- Strengthening Supply Chain Resilience;
- Structural reforms, good regulatory practices, standards alignment, and anti-corruption efforts;
- Updating the region’s ambitions on climate and clean energy; and
- Support for the multilateral trading system and the WTO
Geopolitical and Trade Tensions Remain Elevated
Ameliorating geopolitical and trade conflicts in the region once again topped respondents’ list of issues for APEC Leaders to address at their next meeting. The idea of the deteriorating context has been a top issue top since it was introduced as an issue in 2018. Amongst the plethora of problems/causes of rising tensions, an important question is more exactly what concerns those who selected geopolitical and trade tensions think should be addressed. Over 53 percent of respondents who selected dealing with geopolitical and trade tensions as an issue also selected geo-economic fragmentation as a top risk to growth; 46.6 percent selected increased protectionism and trade wars; and 29.9 percent the Ukraine conflict. However, this analysis is somewhat limited by the range of risks available to respondents to select.
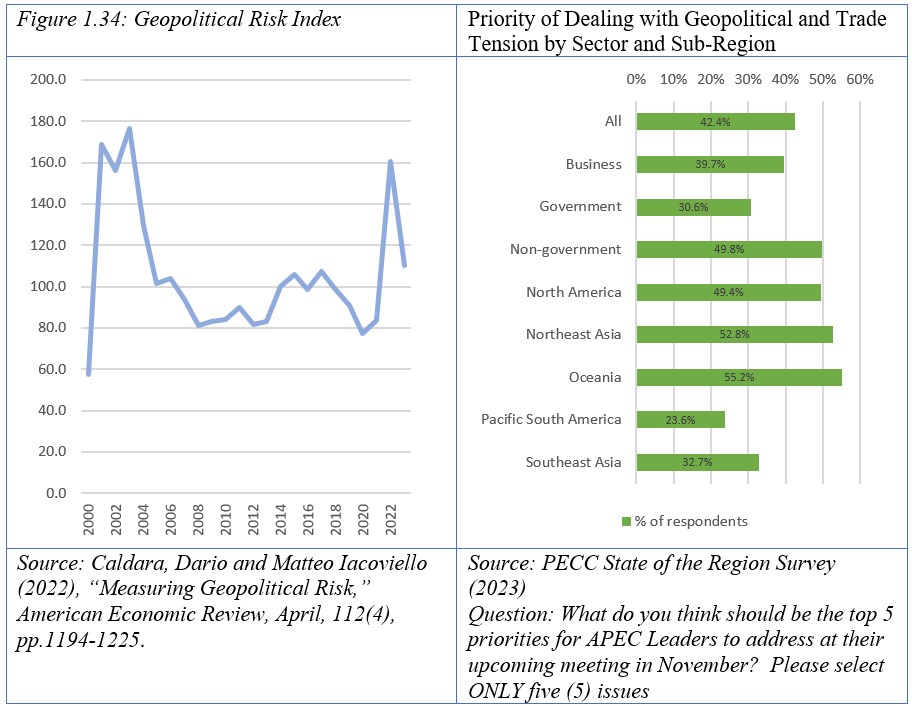
Broader, less subjective measures of geopolitical risk show a considerable spike in risk in 2021 and 2022 with some decline in recent months. Figure 1.34 shows real time political tensions based on newspaper article mentions. Last year’s spike was the highest since that associated with 9-11 and the invasion of Iraq in 2003. Another well-known measure on the geopolitical front is the ‘Doomsday Clock’, a product of the Bulletin of the Atomic Scientists, as the name suggests it is a measure to warn the public of how close the world is to destruction. Dating back to 1947, the time was set to 23:53, or 7 minutes away from doomsday. Over the course of the past half century the time moved back and forth with world events, but it was furthest during the 1991 to 1994 period at 23:43. The clock is now just 90 seconds from midnight, at 23:58:30.
BlackRock’s Geopolitical Risk Indicators (BGRIs) tracks mentions of risks in brokerage reports and financial news stories. They see geopolitics as structural market risks, with direct and long-lasting effects, curbing economic efficiency and growth.[34]
Looking at the priorities by sub-region and sector, there were clear differences among stakeholders and sub-regions on whether they thought APEC Leaders should take on these issues. Close to 50 percent of non-government respondents selected addressing geopolitical and trade conflicts as a top priority while government respondents the least at close to 31 percent. Among sub-regions, 55 percent of respondents from Oceania selected it as a top risk but only 24 percent of those from Pacific South America.
Strengthening Supply Chain Resilience
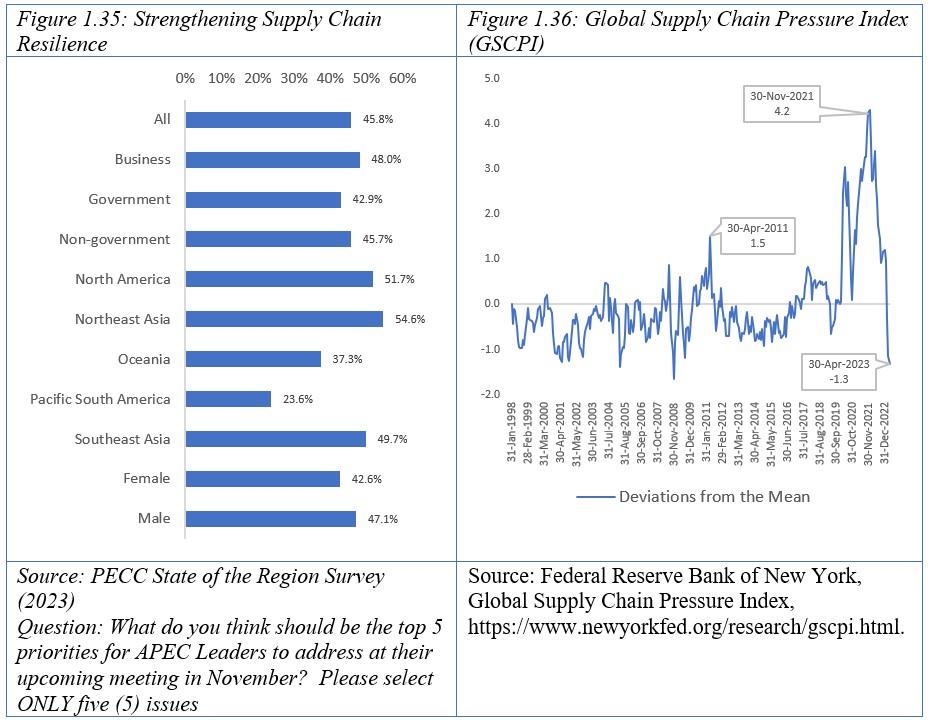
As shown in Figure 1.33 a higher percentage of respondents selected strengthening supply chain resilience as a top priority for the region. However, it was the degree of importance that respondents put on geopolitical and trade tensions that placed it on top of the list of issues for APEC. Figure 1.35 shows the percentages of respondents of different stakeholder groups and sub-regions that selected strengthening supply chain resilience as a top issue. While a larger percentage of business respondents selected supply chain resilience as a top issue, the weighted score each stakeholder group gave was closely aligned with non-government respondents putting a higher degree of importance on the issue. However, among sub-regions there were considerable differences with 55 percent of Northeast Asians selecting it as a top issue and only 24 percent of those from Pacific South America.
What ‘supply chain resilience’ actually means is a subject of some debate. One definition is ‘the ability to return to normal operations over an acceptable period of time, post-disruption.’[35] While the New York Federal Reserve constructed a barometer to gauge the importance of supply constraints with respect to economic outcomes. The index combines shipping and air freight costs together with other variables such as delivery time; delivery delays; and inventory.[36] As shown in Figure 1.36 the index has come down considerably since it reached its peak on 30 November 2021 when it was 4.2 standard deviations from the average. At the end of April 2023, it was 1.3 standard deviations below the average. The previous peak was reached in April 2011 with the Tōhoku earthquake and resulting tsunami, and flooding in Thailand.
However, even as the index has come down, the question is whether the factors behind the increase in supply chain pressures – ie their vulnerability still exist and why respondents to the survey continue to place such a high priority on it. The answer perhaps lies in other metrics, for example, the Business Continuity Institute finds that in spite of the severity of the disruptions caused by the pandemic many ‘organizations are still failing to make basic checks on the business continuity and resilience plans of their most critical suppliers, and reporting data on disruptions is frequently held in Excel spreadsheets and not shared throughout the organization.’ They argue that ‘with COVID-19 still fresh in the mind of senior management, now is the time to request dedicated budget to invest in technological solutions to boost resilience and improve efficiency. They find that 27 percent of firms are not reporting supply chain disruptions, moreover, firm-wide reporting has not increased over the course of the past 3 years.[37] Worryingly the biggest source of supply chain disruptions occur due to human factors, with 47 percent due to a lack of skills and 46 percent due to illness. While technological solutions are often cited as important to increasing supply chain resilience, for example 58 percent of respondents to last year’s State of the Region survey said that the application of new digital technologies are to improve supply chain performance was very important and a further 29 percent important, uptake remains limited at just 41 percent.
Structural reforms and Good regulatory Practices
The third most important priority for APEC Leaders to address at their meeting was structural reform and good regulatory practices with 44 percent of respondents selecting it as a top issue.

Perceptions of the failure to implement structural reforms as a risk to growth and structural reforms as a priority for APEC Leaders’ discussions are juxtaposed in Figure 1.37 and Figure 1.38. As a priority for APEC Leaders’ discussions, non-government respondents selected it the most frequently while government respondents selected the failure to implement them most often. This reverses the findings from last year when business respondents were the most concerned over their implementation or lack thereof. At the sub-regional level, it was Oceania that wanted more attention on this issue at the Leaders’ level, while those from Pacific South America were most concerned about implementation. Previous surveys have shown that the regional policy community believes that vested interests tend to be the biggest barrier to implementing reforms, therefore the risks of regulatory capture remain high, with a need for a broadbased inclusive and transparent mechanism for discussing reforms.
Updating the region’s ambitions on climate and clean energy
The fourth in the list of top priorities was updating the region’s ambitions on climate and clean energy. As far as APEC is concerned this might be interpreted as increasing ambitions on doubling the share of renewables in the energy mix by 2030 and reducing energy intensity by 45 percent by 2035. According to the latest APEC Energy Outlook 2022, if business is continued as usual, APEC will meet the ambition to reduce energy intensity by 45% before 2035 (compared with 2005 levels) by 2026.
These are, of course, scenarios whose realization depends on existing trends in technology development and deployment, and policy frameworks to continue in a similar manner. While improvements to energy efficiency and fuel economy are assumed, with switches from internal combustion engines to electric vehicles. [38] Given this background it seems as though the region can afford to be at least a little more ambitious to give further impetus to efforts to increase investment – both public and private to addressing climate change mitigation as well dealing with issues of adaptation.[39]
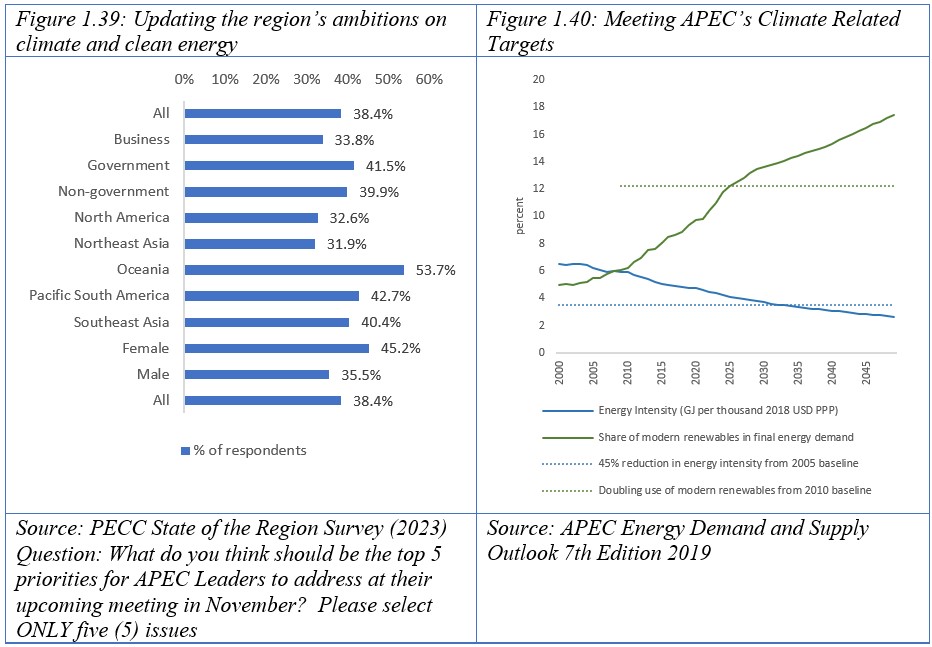
As discussed above, a significantly lower percentage of business respondents to the survey selected climate change as a risk to growth, it is therefore not surprising that they also tended to rank climate change as less as important priority than other stakeholders. For business respondents climate change was only 7th highest in their priorities, whereas for government respondents it was top of the list, while for non-government it was fourth. At the sub-regional level, a greater share of respondents from Oceania selected it as a top issue, while it was lowest for Northeast Asia.
Additionally as shown in Figure 1.39, there was a significant gap between male and female respondents on this issue, 45 percent of women selected updating the region’s climate change ambitions which made it the top issue for them compared to 35 percent of men, which placed it fifth in the list.
Support for the multilateral trading system and the WTO
The last of the top 5 issues was support for the multilateral trading system and the WTO which has long been considered core APEC business. While differences among stakeholder sectors were marginal they were more significant among sub-regions, 57 percent of respondents from Oceania selected it as a top issue, and only 27 percent of those from Pacific South America (see Figure 1.41). The percentage of respondents who selected an issue can at times be misleading on the ‘priority’ of the issue, for example while there is an 8 percentage point gap between men and women on this issue, the ranking of the issue was only 1 place apart with males ranking it 4th and females 5th.
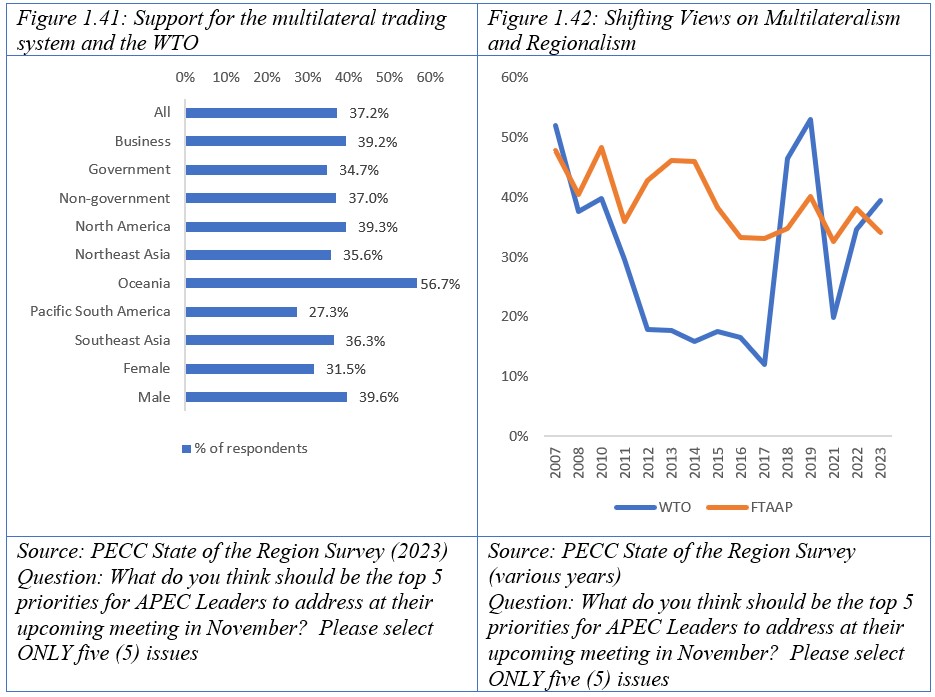
One discernible trend is that with the exception of 2021, a relatively high proportion of respondents have selected supporting the multilateral trading system and WTO as an issue of importance for regional leaders to address since it reached a low in 2017. It took the Appellate Body crisis and the effective disabling of the WTO’s dispute settlement function to put the WTO back front and center in the minds of the regional stakeholders. Even if the problems remain, progress has been made with the delivery of important work such as the WTO Fisheries agreement and the Joint Initiative on Services Domestic Regulation. It will be up to members to make progress on other issues in order to keep the trade system working. Figure 1.42 juxtaposes the percentage of respondents who selected the WTO and MTS as a priority for APEC leaders with the Free Trade Area of the Asia-Pacific. As seen in the chart, attention to the WTO dropped dramatically after the Global Financial Crisis and attention (at least regionally) went towards the Free Trade Area of the Asia-Pacific (FTAAP) idea. At times it might seem as though respondents were making a choice between a regional initiative and a global one. However, that changed after 2018 and even as respondents kept FTAAP as a priority it was not to the exclusion of multilateralism. The thinking at APEC’s inception about open concerted unilateralism may have shifted towards open concerted regionalism or plurilateralism as is now occurring. [40]
Diverging or Converging Views on Priorities?
The remaining issues on the list of top 10 issues shown in Figure 1.33 were:
- Expanding Economic Potential and Opportunity Through Investments in Infrastructure and Workers;
- Inflation;
- Work on the Free Trade Area of the Asia Pacific (FTAAP) Agenda;
- Measures to reduce barriers to growth of the digital economy; and
- Addressing Inclusion in Trade
The need for expanding economic potential and opportunity through investments in infrastructure and workers has been discussed above. As shown in Figure 1.43 while it was 6th highest priority for government and non-government respondents it was 8th for business. This may indicate a need for more business buy-in to the inclusion agenda, in spite of pronouncements by organizations like that of the Business Roundtable’s “Statement on the Purpose of a Corporation”. [41] The difference at the sub-regional level was striking with respondents from Pacific South America making it the 4th highest priority, aligning it with concerns they expressed on the risk coming from the erosion of the social contract.
There were relatively large differences among sub-regions on whether APEC Leaders should address inflation, this despite the rising cost of living being identified as the top risk to growth. It may be because inflation and monetary policy are perceived as non-APEC issue better addressed elsewhere. However, it was still identified as the 4th most important issue for business and Northeast Asian respondents with other groups and sub-regions ranking it lower down.
Respondents did not forget about one of APEC’s long-standing goals to achieve a Free Trade Area of the Asia-Pacific. While 8th overall, it was 2nd highest for respondents from Pacific South America and 5th for business. Strikingly, work on the FTAAP was only 11th for government and female respondents and only 13th for Southeast Asia. Even though 31 percent of all respondents selected it as a top issue, other issues tended to come ahead as priorities. This may reflect a belief that however desirable it may be as a vision, the timing is not right.
Of note was that even though the digital economy is widely seen as critical to future economic growth, respondents were aligned in placing it ninth in its relative importance on the APEC Leaders’ agenda. However, as seen throughout the survey results, work on the digital economy is essential for inclusion – whether to deal with the transition for individuals or to broaden and deepen engagement in international trade
Last in the overall top 10 was addressing inclusion in trade. As with earlier comments on business views on expanding economic potential and opportunity through investments in infrastructure and workers, business respondents ranked this issue much lower than other stakeholders, ranking it 16th out of 20 compared to 8th for government and 10th for non-government. Conversely, even though respondents from Pacific South America ranked expanding economic potential and opportunity through investments in infrastructure and workers 4th highest, inclusion in trade was ranked only 4th.
Lastly, two issues that were considered top 10 priorities by some stakeholders/sub-regions but not for others were:
- Promoting cybersecurity;
- Promoting Food Security; and
- Women’s economic participation in the economy
While businesses ranked cybersecurity as 10th most important it was a lowly 18th for government. This divergence on cyber has been present for a number of years and indicates a need for public-private dialogue on the importance of the issue. Food security was 6th and 7th most important for Pacific South America and Southeast Asia respectively but only ranked 11th overall. Finally, women’s participation in the economy, a key part of the inclusion agenda was only ranked 12th overall, but 7th for respondents for North and Pacific South America, and also for women. As discussed earlier, this indicates a need for more gender balance in priority setting and decision-making.

Stakeholder Engagement Critical for More Inclusive Growth
As demonstrated by the survey results above, views on key issues and what should be priorities for APEC varies by sub-region and type of stakeholder. Even as inclusive growth made a priority by APEC and supportive words are written each year on this topic, often little is said of past initiatives such as the APEC Agenda on Advancing Economic, Financial, and Social Inclusion in the APEC Region. Greater stakeholder engagement would not only increase the inputs on policy options but also increase transparency, accountability and buy-in. One part of that agenda needs to be a two-way discourse among stakeholders, for example, on why businesses need to pay attention to the sustainability and inclusion agenda. While these are part of ABAC work, that they ranked relatively lowly on the list of priorities gives pause for thought. Moreover, the difference in priorities between male and female respondents was also instructive and highlights the need for engagement.
[1] For the purpose of this report, the Asia-Pacific is defined as the economies that are members of the Pacific Economic Cooperation Council (PECC); the Asia-Pacific Economic Cooperation (APEC) forum; and the East Asia Summit. While membership of these organizations overlap there are differences. The economies covered in the ‘Asia-Pacific aggregate are: Australia; Brunei Darussalam; Cambodia; Canada; Chile; China; Colombia; Ecuador; Hong Kong, China; India; Indonesia; Japan; Korea; Laos; Malaysia; Mexico; Myanmar; New Zealand; Papua New Guinea; Peru; Philippines; Russia; Singapore; Chinese Taipei; Thailand; United States of America; and Vietnam
[2] IMF World Economic Outlook, Chapter 3
[3] See for example Simon Evenett, “Débâcle: The 11th GTA Report on Protectionism”, 2012
[4] Patrick Low and Eduardo Pedrosa, “The State of Trade in the Region”, 2015
[5] Jorge Alvarez and Niels-Jakob Hansen , “Wage-Price Spiral Risks Still Contained, Latest Data Suggests”, IMF, 2023
[6] International Monetary Fund. 2023. World Economic Outlook: A Rocky Recovery. Washington, DC. April 2023.
[7] See OECD, Decoupling of Wages from Productivity: What Implications for Public Policies?”, 2018, OECD
[8] Graeme Hugo, “Demographic Change and International Labour Mobility in the Asia-Pacific Region - Implications for Business and Regional Economic Integration”, 2008, PECC
[9] McKinsey Global Institute, The Social Contract in the 21st Century: Outcomes so far for workers, consumers, and savers in advanced economies, , 2020, McKinsey
[10] APEC Leaders’ Declaration 2021, https://www.apec.org/meeting-papers/leaders-declarations/2021/2021_ilr
[11] Deloitte, Women in the boardroom: A global perspective
[12] WTO, Recent Evolution of Developed Economy MSME Participation in International Trade, 2016
[13] Corinne Deléchat and Leandro Medina, “What is the Informal Economy?” IMF, 2020
[14] Kostas Mavromas, The Future of Jobs and Skills, PECC State of the Region Report 2017
[15] Kostas Mavromaras, Op Cit
[16] David Trefler, “What is artificial intelligence bringing to international trade?” Hinrich Foundation, 2022
[17] Dell Technologies and the Institute for the Future, “Realizing 2030: A Divided Vision of the Future.”
[18] Bjorn Lomborg, “The Evidence on Education Reforms” Project Syndicate, 2016G
[19] APEC Education Strategy 2016-2030, APEC Secretariat
[20] Bjorn Lomborg, Best Things First: The 12 most efficient solutions for the world's poorest and our global SDG promises”, 2023, Copenhagen Consensus, 2023
[21] OECD, “What happened to jobs at high risk of automation?” 2021.
[22] JANCPEC, “Towards a More Resilient Society: Lessons from Economic Crises”, Report of the Social Resilience Project 2010
[23] APEC Policy Support Unit, APEC Strategy for Strengthening Quality Growth Final Assessment Report, 2020
[24] Monica Wihardja, “Why e-commerce is key to Indonesia’s small businesses”, World Bank 2021
[25] Penelope Naas, “SMEs and international trade barriers: World Economic Forum
[26] Ebay, United States Small Online Business Report, 2021
[27] Cyn-Young Park and Rogelio V. Mercado, Jr , Financial Inclusion: New Measurement and Cross-Country Impact Assessment, ADB Economics Working Paper Series, 2018 Assessment
[28] Ipsos Global Advisor 25-Country Survey for the World Economic Forum, “World Opinion on Globalization and International Trade”, 2021
[29] Bruce Stokes, “Trade Widely Seen as Good”, Pew Research Center, 2018
[30] Joost Pauwelyn, “Taking Stakeholder Engagement in International Policymaking Seriously: Is the WTO Finally Opening-Up?” Special Issue on the 25th Anniversary of the Journal of International Economic Law, 2022
[31] USITC, Distributional Effects of Trade and Trade U.S. Policy on U.S. Workers, US International Trade Commission, Investigation Number: 332-587, Publication Number: 5374, 2022
[32] Kenichi Kawasaki, The State of Play of Regional Economic Integration Initiatives, PECC State of the Region Report, 2017
[33] https://www.apec.org/groups/committee-on-trade-and-investment/cti/info
[34] Blackrock, Geopolitical Risk Dashboard, April 2023.
[35] Sébastien Miroudot, Resilience versus robustness in global value chains: Some policy implications, CEPR. 2020
[36] Gianluca Benigno, Julian di Giovanni, Jan J. J. Groen, and Adam I. Noble, “A New Barometer of Global Supply Chain Pressures” Federal Reserve Bank of New York Liberty Street Economics, January 4, 2022
[37] Business Continuity Institute, Supply Chain Resilience Report 2023
[38] Asia Pacific Energy Research Centre (APERC), APEC Energy Demand and Supply Outlook, 8th Edition 2022 Volume 1.
[39] See Tilak Doshi, Climate Change: From Ambition to Action, State of the Region Report 2021-2022, PECC.
[40] Robert Basedow , “East Asia needs to tap into plurilateralism’s potential”, East Asia Forum, 2023
[41] Business Roundtable, “Statement on the Purpose of a Corporation”, 2019
<< Previous
Next >>
There are only three other issues where government and business perceptions of risk diverge to such an extent: food security; shortage of available talent/skills; and a possible wage-price spiral. While food security and a wage price spiral are not on the top 10 list, 18 percent more government than business respondents selected it as a top risk.