Chapter 1: The Economic Impact of the Covid-19 Crisis
Even before the Covid-19 pandemic hit, the regional policy community was pessimistic on the prospects for growth in 2020 as a result of rising trade tensions across the world: now we are in the midst of a worse scenario than could ever have been expected. However, while the Asia-Pacific is at the epicenter of the shock, through its long-established norms and processes it can be at the heart of the solutions.
In spite of warnings, not even the most advanced economies were sufficiently prepared and equipped to deal with a health crisis of this magnitude. It had elements of both a demand and a supply shock. To prevent the rapid spread of the Covid-19 virus, many governments across the region and the world adopted measures that temporarily shut down much of the economy. The shocks are highly connected internationally, via supply chains, disruption to which was the focus in the first two months of the year. But that aspect of the shocks was greatly magnified by the unprecedented and abrupt stop in demand. Even as the first half of the year comes to an end, and some economies relax or exit from lockdowns, it remains extraordinarily difficult to reach even tentative conclusions on economic growth for the rest of the year.
Reflecting that uncertainty, the IMF’s forecast for the global economic growth in April this year was for a contraction of 3 percent, the World Bank’s made in June was for a fall of 5.2 percent, the OECD’s forecast also in June set out two scenarios: a single hit of 6 percent and a ‘double hit’ from a second wave of 7.6 percent. Differences in methodology aside, the later the forecast, the worse theprognosis. By June the IMF had downgraded its forecast for the global economy to a contraction of 4.9 percent.
This report focuses on how regional cooperation can provide governments with more options for recovery in the face of these uncertainties. The data reported here is based on a special survey PECC undertook on the impact of the Covid-19 crisis on the region. A total of 710 policy experts from business, academia, government and civil society responded to the survey which was conducted from 19 May to 12 June, 2020. An analysis of the responses provides insights for further commentary on the regional outlook, the strategies available for transitioning out of the current situation and the contributions that regional cooperation can make. The following parts treat the content in that order. The report concludes with some observations on the role of APEC and regional cooperation.
Outlook for the Asia Pacific Region
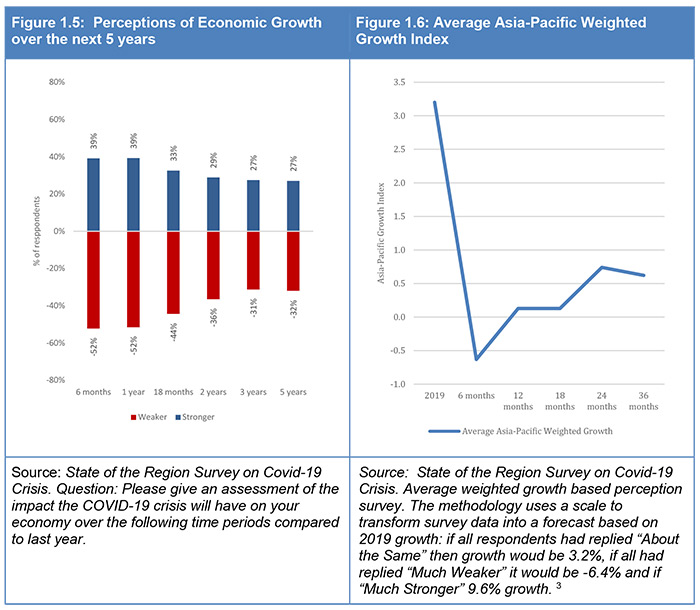
Based on June IMF estimates, the regional economy is expected to contract by 4.7 percent in 2020. This is far worse than the comparable decline of 0.6 percent in 2009 following the Global Financial Crisis (GFC). As seen in Figure 1.3, and as stressed by the IMF in April
“[I]t is very likely that this year the global economy will experience its worst recession since the Great Depression, surpassing that seen during the global financial crisis a decade ago.”
The IMF anticipates that once lockdown measures are ended, economies will swiftly rebound, as evident in Figure 1.3. However, in addition to downgrading the forecast for 2020, expectations for the recovery in 2021 have become more muted. The IMF’s revised its forecast for global growth down from 5.8 percent to 5.4 percent.
The picture for unemployment (Figure 1.4) is just as dire, with the rate in the region expected to rise from 3.9 percent to 5.5 percent this year. The assumption behind this scenario is that the pandemic will ebb, and the containment measures will be loosened in the second half of the year, and if production capacity remains, the recovery in employment will also be v-shaped.
Beyond unemployment, the impact of the crisis on poverty reduction is likely to be disastrous. Estimates from experts at the World Bank suggest the number of people living in extreme poverty (people living on less than $1.90 a day) will increase from 595 million to 684 to 712 million people. 1 Should the worst-case scenario materialize it will wipe out all poverty reduction over the last 5 years. The lower number is contingent on a relatively swift recovery. The Covid-19 crisis is already having a clear impact on global ambitions to reduce poverty and attempts to make growth more inclusive.
The assumptions in the previous paragraphs are easily challenged. On the real side of the economy, will capacity remain if supply chains are broken? Even if capacity supports an increase in output, what will have been the effect of this experience on the confidence of investors and consumers?
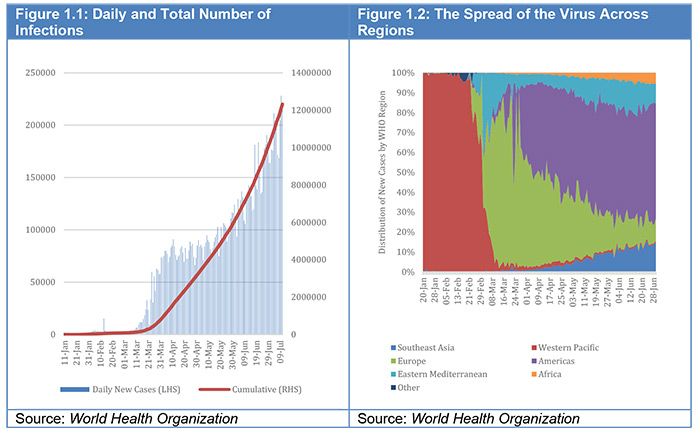
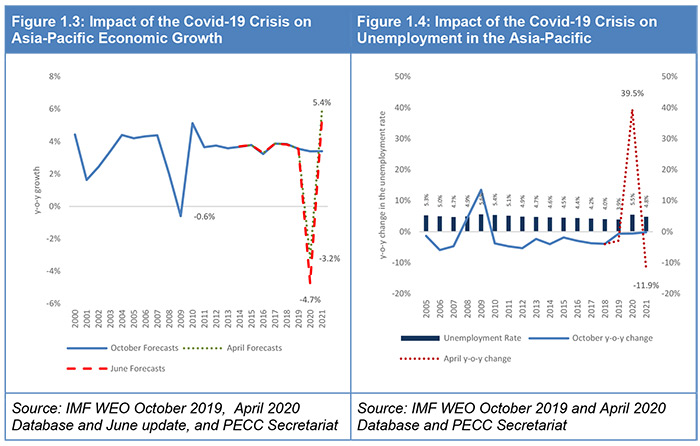
Furthermore, the global crisis appears to be not over, which may have a continuing effect on confidence. The total number of cases is continuing to rise (Figure 1.1), although in different locations: the evolution of the pandemic from the beginning of the year through to the end of June seems to have gone through a number of phases: from February to March when infections were concentrated in East Asia and then across into Europe and now the majority of new cases in the Americas (Figure 1.2). As discussed later this sequence has important ramifications for trade and highlights the importance of an open trading system for resilient societies and the value of policy cooperation.
Another question is what are the risks of a second wave of infection and what are its consequences? A number of economies , not surprisingly with the virus still at large, have experienced a rise in the number of infections as restrictions have been relaxed. At this point in time, there is little ability to evaluate the risk of a second wave of infection.
Based on survey responses and other material, we explore these questions in the next part of the report. We first examine survey respondents’ expectations of growth and then consider their views on the risks to growth.
Will the Recovery be a V, W, a U or a Swoosh?
To get a sense of views around the region with respect to their own individual economies, we asked survey respondents to give their assessments of the impact of the Covid-19 crisis on their economies with respect to growth in 2019. We note however that there remains a great deal of uncertainty over the size of the shock, its duration, implications for stabilization policies and an eventual recovery. This uncertainty makes it extraordinarily difficult, not only for our respondents to assess the situation, but also to formulate policy which may lead to delayed actions.
Figure 1.5 provides a simplified presentation of the survey data. Reflecting the uncertainties at present, the dispersion of opinion is wide in the short term, and even as far out as 3 years on opinions diverge on both sides: by then, 27 percent of respondents expect growth to be stronger than the baseline year of 2019 and a large group of 31 percent expect growth to be weaker.
We go a step further in Figure 1.6 to use the survey results to answer the questions of ‘how deep and how long’ respondents think the impact of the crisis will be. Respondents were asked to assess the impact of the crisis on their own economies: in order to derive average Asia-Pacific weighted growth index. Responses have been averaged for each economy and weighted for the size of each economy’s GDP in 2019, and then the weighted average is plotted for each time horizon. This methodology predicts a somewhat similar outcome for 2020 as actual economic forecasts but where it differs substantially is views for 2021. While current forecasts by multilateral agencies are for a rebound for regional economic growth to 5.4 percent, respondents to our survey are much more pessimistic, barely expecting a rebound over the next 3-5 years.
While expectations for individual economies differ significantly, the conclusion from the survey is that respondents expect a ‘swoosh’ shaped recovery for the Asia-Pacific over a 5-year period, as seen in Figure 1.6.
While this is a survey taken at a particular time, and policy interventions can change these perceptions, the extraordinarily pessimistic view amongst respondents has important policy consequences. Low levels of confidence about the future lead to lower spending levels for both households and businesses. 2 Ultimately that confidence will only be restored when the pandemic is over, and a vaccine is discovered. In the nterim, international cooperation is essential across a range of issues that would reduce uncertainties about the future.
Risks to Growth
Each year respondents are asked to select the top 5 risks to growth for their economies. How has the policy and stakeholder community’s assessment of those risks changed?
Figure 1.7 shows three dimensions of respondents' answers for the top 5 risks. The ranking of the top five risks combines data on the percentage of respondents who selected the item as a top five risk (an indicator of its likelihood), and the impact of the event. The results are plotted in Figure 1.7 against frequency (vertical axis) and impact (horizontal axis).
Health Pandemics
Not surprisingly, health pandemics were identified as the largest risk to growth: 63 percent of respondents selected pandemics as a top 5 risk to growth for their economy. This is a reversal of the survey findings in 2019 when it was the lowest risk to growth, when only 4 percent of respondents selected it as a risk.
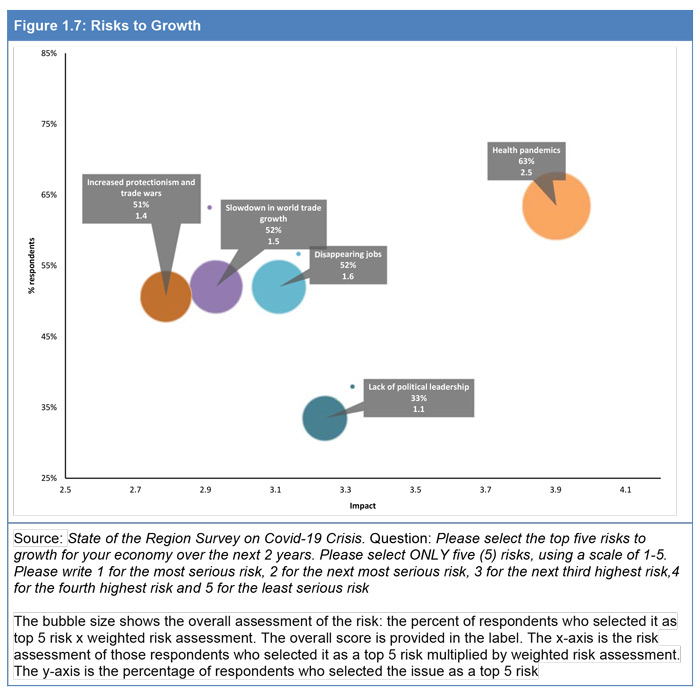
Figure 1.7 illustrates the significance of three other items, each of similar likelihood, one with higher impact related to jobs and another two related to trade (overall growth in trade but also protectionism). The fifth item in the Figure concerns the lack of political leadership, which is associated with a lower level of likelihood but greater impact. We discuss each of these items in later sections.
Figure 1.8 compares respondents’ views on risks in 2019 and 2020, which illustrates the greater attention now given to health pandemics. The red shaded results are in the top 10 group for each year, the darker the shade the more respondents selected that item. The blue shaded results are components of the bottom half, where the darker blue the fewer respondents selected the risk. As seen in the table very few respondents picked health pandemics as a risk in 2019 - in fact it was the least frequently selected risk by respondents. This year it was the most frequently selected risk.
Other items and ones consistently seen as risks to growth throughout the period include (in addition to those in Figure 1.7):
- A slowdown in the Chinese economy
- A slowdown in the US economy
- Failure to implement structural reforms
- Climate change
- Unsustainable Debt
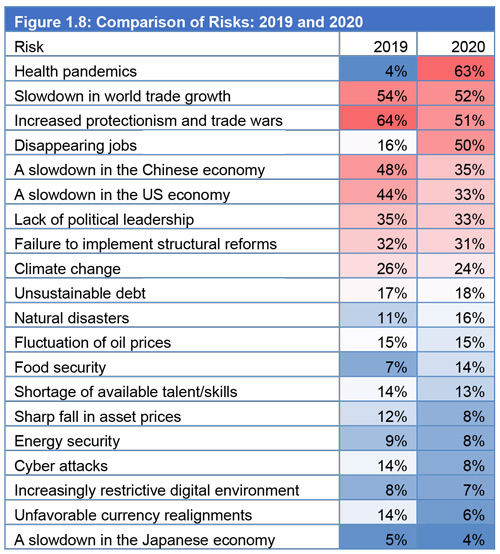
Although not in the top ten list, there was a large rise in the percentage of respondents who selected food security as a risk to growth, especially among respondents from Southeast Asia, 21 percent of whom selected it as a top ten item. Least concerned were respondents from Oceania, only 4 percent of whom selected food security as a risk. This divergence suggests the possibility of stronger cooperation on this issue between the two sub-regions.
An excellent example of this cooperation, and an illustration of the regional leadership in the response, is the Declaration on Trade in Essential Goods for Combating the Covid-19 Pandemic signed on 15 April by Singapore and New Zealand which includes food products. (This and other examples of a regional response are discussed in the section on cooperation below). This builds on the earlier Joint Ministerial Statement to ensure supply chain connectivity amidst the COVID-19 situation among nine economies (Australia, Brunei Darussalam, Canada, Chile, Laos, Myanmar, New Zealand, Singapore and Uruguay).
Increased Protectionism and Trade Wars
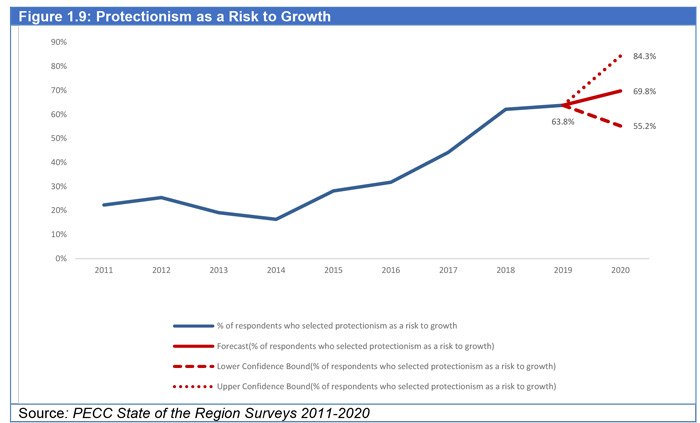
Protectionism has been rising as a risk to growth over the past 10 years. The percentage of respondents selecting protectionism as a top 5 risk to growth for their economy has been steadily growing from 25 percent in 2011 to 64 percent in last year’s survey. To illustrate the significance of this risk, and based on this trend in survey responses, the 2020 figure would have been expected to have increased again (shown in Figure 1.9). Instead, the result was 51 percent. Its significance has been crowded out, at least temporarly.
However, the result that protectionism is now the 4 th highest risk brings little comfort. The risk of protectionism, especially as economic growth plummets is a grave concern. The experience of the Great Depression and of the Global Financial Crisis, and their consequences for protection, should not be lost on policy makers. Significantly, G20 Trade Ministers agreed
“that emergency measures designed to tackle COVID-19, if deemed necessary, must be targeted, proportionate, transparent, and temporary, and that they do not create unnecessary barriers to trade or disruption to global supply chains, and are consistent with WTO rules.”
They also agreed that
“We will ensure smooth and continued operation of the logistics networks that serve as the backbone of global supply chains. We will explore ways for logistics networks via air, sea and land freight to remain open, as well as ways to facilitate essential movement of health personnel and businesspeople across borders, without undermining the efforts to prevent the spread of the virus.”
Both APEC Trade Ministers and importantly ASEAN Leaders have agreed to variations on this language.
Slowdown in World Trade Growth
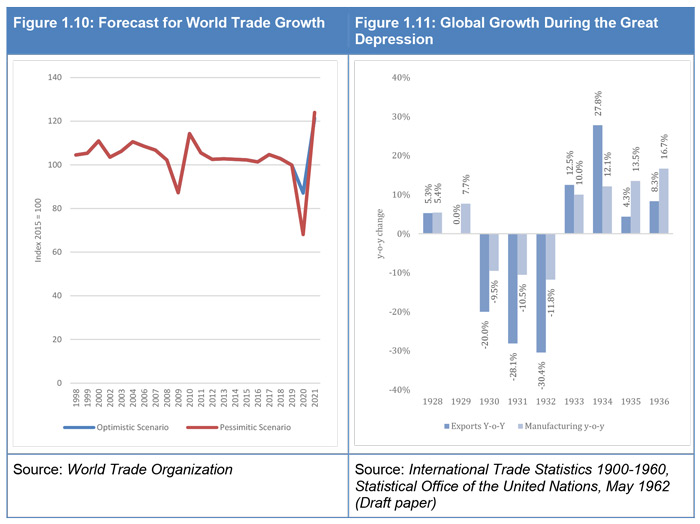
A slowdown in world trade growth was already a top 5 risk in the 2019 survey and remains high on the list of our community’s concerns. Even the most optimistic scenario by the WTO is for a contraction in world trade of 13 percent, with the most pessimistic at 32 percent, as shown in Figure 1.10. The more optimistic outcome is that the WTO currently expects a V-Shaped recovery in 2021 as the global economy recovers, but again this is contingent on numerous factors such as the length of the crisis, and policy measures adopted, including the reversal of “temporary” measures adopted during the crisis. There is positive news in this respect: the latest WTO Report on G20 Trade Measures 4 found that by mid May 70% of all COVID- related trade measures were trade facilitating. Of the measures which were trade restricting export bans had accounted for 90 percent, but also by mid May 36 percent of restrictive measures had been repealed. The WTO Director General observed that.
...not since 2014 have import-facilitating measures implemented during a single monitoring period covered more trade. There are signs that trade-restrictive measures adopted in the early stages of the pandemic are starting to be rolled back.
Much has been made of the comparison between the depth of this crisis and the Great Depression. Data on the actual impact of Great Depression was developed after it took place, as noted by the APEC Policy Support Unit the measurement of
“GDP was ... conceived in the 1930s in the aftermath of the Great Depression... trying to understand the causes and impacts of the Great Depression”
Figure 1.11 is derived from a post-hoc analysis done by the United Nations in the 1960s, which shows the year-on-year change for two indices that the UN created, the value of total exports for a group of 22 economies and manufacturing production. As seen in Figure 1.11, exports began to fall precipitously in 1930 at twice the rate of overall manufacturing and then at 3 times the rate in 1931 and 1932 as economies around the world began to raise levels of protection. Eichengreen and Irwin calculate that the ad valorem rise in trade costs between 1928 and 1935 was in the region of 8 to 24 percent depending on the bilateral relationship. 7 During the 2008-2009 crisis, high frequency data also show that global trade fell much more steeply than overall aggregate demand (see below). Despite the initial success of multilateral cooperation in preventing a descent into tit-for-tat protectionism as had been feared at that time, it too was followed by what was initially creeping protectionist measures but eventually became increasingly hostile trade relations. The IMF has estimated that the impact of trade tensions on global GDP was around 0.8 percent in 2019.
In the current context, there are once again significant fears of rising protectionism, especially export restrictions in response to shortages of medical supplies. However, international agreements amongst G20, APEC, and ASEAN to constrain behavior discussed below thus far have prevented the kind of systemic breakdown witnessed in the 1930s. Even so, further pressures on supply chains and missteps that discourage investment and production need to be watched carefully. As described by Eichengreen and Irwin, the breakdown of the system in the 1930s did not happen overnight nor in response to single events. While the global system is now more robust than it was then, with global safety nets and flexible exchange rates in place, the slide into protectionism in the 1930s led to three consecutive years of global trade and production decline.
The Covid-19 Crisis has highlighted the importance of high-frequency quality data to understand both the readiness of societies to cope with a crisis of this nature but also to assess the efficacy of policy interventions (see section below). 9 Data on trade by month available from the CPB World Trade Monitor (WTM) summarizes worldwide data on international trade and industrial production covering a sample of 86 economies. 10 Figure 1.12 and 1.13 show respectively the impact of the Global Financial Crisis (September to December 2008) and the Covid-19 Crisis (January to April 2020) on merchandise trade.
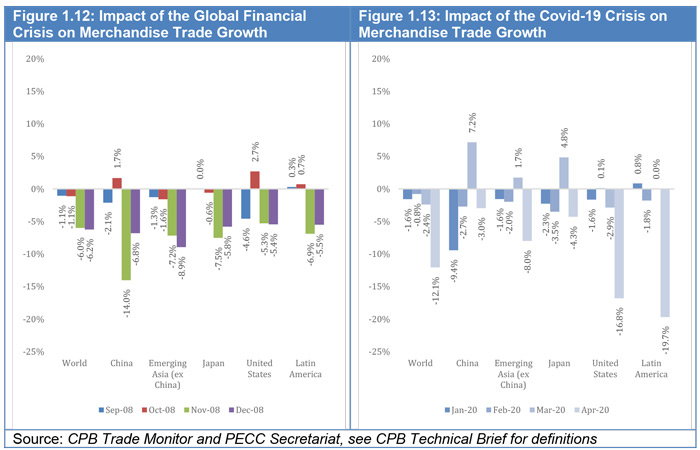
In Figure 1.13, world trade decreased by 12.1% month-on-month (while world industrial production decreased 8.1%) in April 2020. The trade fall was much sharper than the decline during the Global Financial Crisis (compare Figure 1.12). Also, the COVID crisis differs in the sequencing of the impact across economies, impacting economies at different times, as we also noted earlier with respect to the data in Figure 1.1. It occurs with varying severities especially in the early phases, which has valuable consequences for policy cooperation. As seen in Figure 1.13, the crisis hit East Asia earliest with the supply side crunch. Merchandise trade for China fell by 9.4 percent led primarily by a fall on the export side. As the crisis progressed other economies have also become more affected by the crisis as shown in the drop in world trade. Baldwin and Evenett argue that this situation created an opportunity, but one which (as we have seen) may not have been understood and grasped:
“implies that buyers can switch between suppliers and so reduce the risks of depending on any one of them. This facet of globalization should be seen as a massive risk mitigation device. But for international trade to deliver its magic, supply routes must be kept open. Too many governments turning inward would frustrate this, exacerbate the coming collapse in world trade, and represent an unforced error of historical proportions. The price paid is not abstract – it is in lives lost.”
Disappearing Jobs
As shown in Figure 1.4 above, based on the IMF’s April estimates, the unemployment rate in the Asia- Pacific is expected to increase from an estimated 3.9 percent of the labor force to 5.5 percent, or a year-on- year increase of 39 percent. This brings unemployment levels to the same depths as those during the Global Financial Crisis. This is a conservative estimate, not only because of the downgrade in the overall economic growth forecast since then, but data from the International Labor Organization (ILO) show that global working hours declined in the first quarter of 2020 by an equivalent to approximately 130 million full- time jobs. For the second quarter the ILO expects the equivalent to 305 million full-time jobs to be lost. 12 The numbers may understate the fall in employment because a large number of people have left the workforce. There may also be a lag effect as some economies have implemented wage subsides which have delayed recorded unemployment.
‘Disappearing jobs’ has leapt from being the 11 th highest risk to growth in the 2019 survey to the 2 nd highest risk. Concerns of respondents at that time might have been more about digitization and automation and their impact on employment. The current crisis has had direct impacts on employment but these original concerns remain, and in fact may be accelerated by the crisis and the experience of the response to it, including new ways of doing work.
The increases in unemployment vary by sub-regions. The worst hit by far will be North America where the rate of unemployment is expected to more than double from 3.8 percent to 9.1 percent. Next worse hit will be Oceania where unemployment is expected to increase from 5.2 percent to 8.2 percent, followed by Southeast Asia, Pacific South America and then Northeast Asia.
These figures are affected by significant informal employment in a number of Asia-Pacific economies, where the impact may not be counted, as well as by different measurement systems. This crisis is also different in its extremely rapid impact. For example, in the United States alone unemployment in April rose by 20 million. However, the expectation is that once quarantine measures are lifted, many people will return to the same employers – a survey by the US Federal Reserve found that among those who had lost a job in March 2020, 91 percent had already returned to work for the same employer or expected to do so. 13 This is seen in the latest data which showed a decline in the US unemployment rate. 14 In short, the situation is extremely volatile and difficult to assess a continual theme of this report.
High rates of employment in the informal sector put workers are at risk, when the shutdowns impede their access to customers, since they are not covered by social welfare systems. Previous work by PECC has proposed that structural reforms will bolster the creation of formal sector jobs by lowering the costs of hiring and firing. This, as well as wage and working hours flexibility plus improved social insurance coverage for laid-off permanent workers, can help bring members of such disadvantaged groups from informal into formal sector employment.
The ‘gig economy’ provides opportunities for self-employed workers. As noted by the 2017 APEC Economic Policy Report
apps like Uber and Grab give people an opportunity to provide transport services and earn revenue.
But these jobs typically also lack social insurance. More recent data suggests that high rates of turnover of workers registering on these platforms go down as outside employment options improve. For many people such jobs are either seen as temporary solutions until better jobs can be found, or they are secondary jobs that provide supplemental income.
These social issues are significant in the response to the pandemic. Quarantine policies which are effective have to be fully aligned with economic and social policy. For example, unless people know that their healthcare will be paid for, they are likely to postpone early treatment and stay active, especially if they lack a savings cushion, increasing health risks for society. Also, some commentary on the COVID experience, or looking forward on the design of a response to a second wave if it occurs, are that quarantine policies could be designed in a more specific way for particular groups in society, which deals more efficiently with the expected impacts of the pandemic.
A further point for policy attention is the differentiated impact the crisis has had on specific sectors or forms of employment. 19 For example, of the estimated 20 million job losses in the United States in April, 37 percent were in the leisure and hospitality sector. Of those jobs more than 80 percent were in food services and drinking establishments. With respect to forms of employment, staff in some economies have been encouraged to work from home, yet those most able to do so are likely to be relatively highly skilled with higher incomes. Mid skill workers are more likely to be laid off. Low skill workers may continue to work in various essential services other than health (eg public transport). 20 As noted above, the COVID experience may also encourage the digitization of mid skill jobs, reinforcing the trend of hollowing out of the labor force by skill level.
Lack of Political Leadership
A lack of political leadership was the 5 th highest risk in this survey, and respondents continue to assess its impact as being relatively large (Figure 1.7). As seen in Figure 1.8 it was also a top 5 risk in 2019, a similar 33 percent of respondents selected it as a risk to growth for their economy compared to last year which was at 35 percent. There were considerable variances among sub-regions on this risk: more respondents from the North America and Pacific South America selected this as a risk to growth than other sub-regions 51 percent and 41 percent respectively, compared to Southeast Asia, Oceania and Northeast Asia, 35 percent, 27 percent and 22 percent respectively.
Generally, in times of crisis, attention is drawn to the capacity of leaders, their popularity can shift significantly and diverge across levels of government. Support rises for those who appear to be dealing with the issue, while others suffer. However, that shift in support may be based on the health measures adopted. A wider range of views is likely to be held with respect to economic management, where respondents to this survey may also be taking a longer-term view. Their response may well be linked with concerns over the inability of the political leadership to address consistent concerns over growing protectionism, the failure to implement structural reforms, or the ability of governments to extract themselves from their current participation in the economy.
<< Previous
Next >>