Asia-Pacific Economic Outlook
Section 1: Towards a Sustainable Recovery
The Asia-Pacific region has shown remarkable resilience in the face of an uncertain environment. However, as the region heads into a ‘new normal’ the shape and form of economic growth are likely to be substantially different from the pre-pandemic period. As demonstrated by concerns expressed by respondents to PECC’s annual survey, the regional policy community is concerned with the rise in the cost of living; climate change; a slowdown in world trade growth; geo-economic fragmentation; and increased protectionism and trade wars. All of these risks, if they materialize, will impact APEC’s efforts to achieve the Putrajaya Vision of an open, dynamic, resilient and peaceful Asia-Pacific community by 2040, for the prosperity of all our people and future generations.
On 5 May 2023, the head of World Health Organization (WHO) announced an end to COVID-19 as a global health emergency.[1] Since 30th January 2020, when the WHO declared a public health emergency of international concern over the global outbreak of COVID-19, approximately 6.9 million people have died out of 795 million cases. Although the crisis seems to be over, rather than returning to the growth pattern prior to the pandemic, the outlook remains unstable, filled with downside risks both for the immediate future as well as over the medium to longer term.
Slower Regional Growth
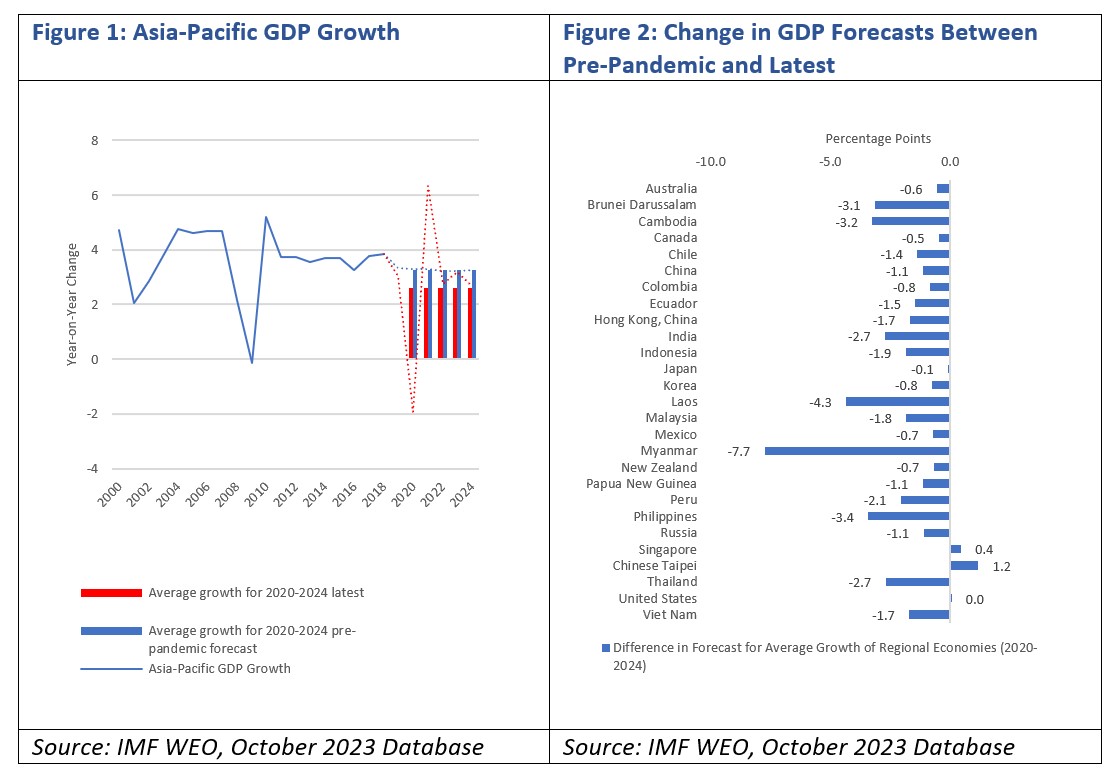
Prior to the pandemic, the expected average growth rate for the 2000-2024 period was about 3.3 percent a year, more recent forecasts expect regional growth to be 0.7 percentage points lower at 2.6 percent. This year, the region is expected to grow by about 3.2 percent before weakening to 2.7 percent in 2024. This stands in sharp contrast to the heady days of the 1990s, when, in spite of the 1997-98 crisis the region grew at 3.5 percent and again in the 2000s when, again, even with the Global Financial Crisis, the region grew at an average of 3.4 percent.
Moreover, the Asia-Pacific has long been the ‘engine’ of the global economy, outpacing global growth. Over the immediate future, global growth is expected to surpass the regional average. The challenge for this region is how to regain growth momentum. This looks to be a monumental task given the high levels of uncertainty and geo-political and geo-economic trade tensions in the world, many of which come from this region. This underscores the need for productivity enhancing reforms that promote not only growth but inclusion and sustainability.
Section 2: Inflation: Higher for Longer
Respondents to this year’s State of the Region survey underscored the rising prices people are confronting across the entire Asia-Pacific and the world. This continues the trend from 2022 when respondents were considerably more concerned about inflation than other risks.
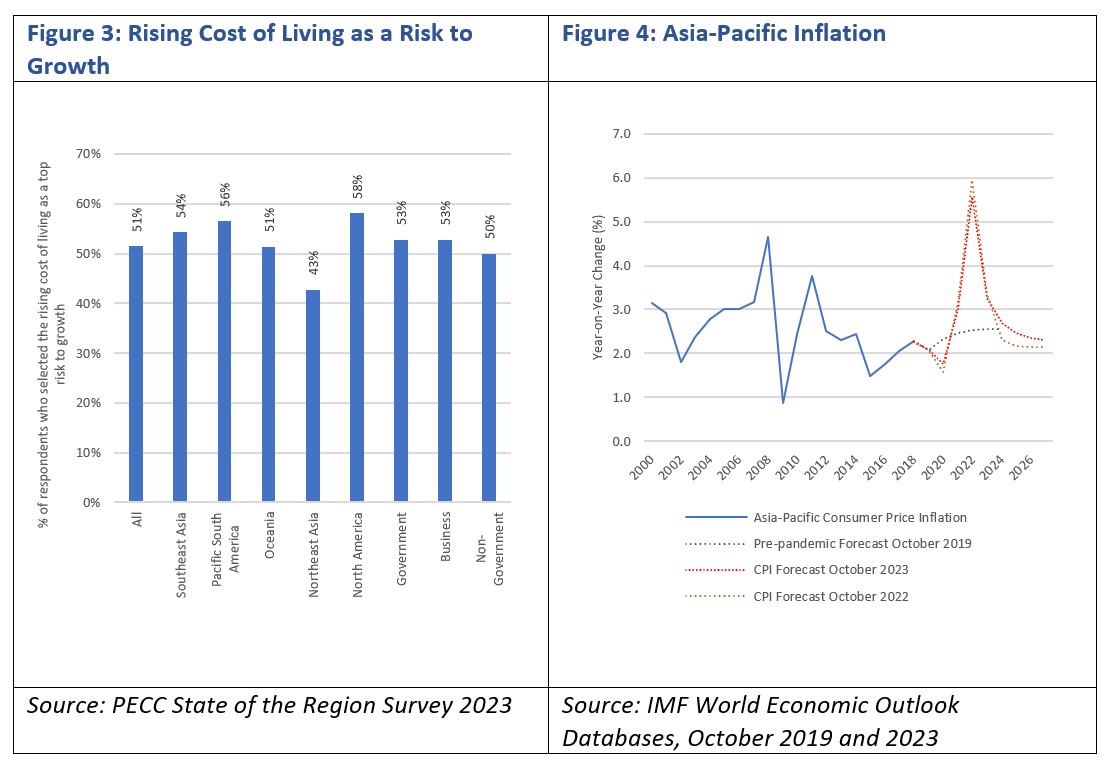
The IMF expects inflation to remain above average pre-pandemic levels through to 2027. For the entire period from 2000-2019 average global inflation was around 3.9 percent, for the next 5 years, inflation is expected to be, on average, 4.6 percent, before dropping to 3.8 percent in 2028. As shown in Figure 3, 51 percent of all respondents selected the rising cost of living as a top 5 risk to growth for their economy. However, while high percentages of respondents in all sub-regions selected the rising cost of living as a risk, there were some differences, North Americans were most concerned, while those from Northeast Asia were considerably less so. This difference was not seen at the sectoral level with similar percentages of respondents selecting the rising cost of living as a risk for business, government and non-government alike. As shown in Figure 4, the pre-pandemic forecast for inflation in the region was around 2.5 percent on average, moreover, the latest forecast is for inflation to remain higher for longer compared to last year’s forecast, with CPI inflation returning to a baseline of around 2.3 percent.
However, perhaps what is more important in terms of APEC’s vision of a more inclusive region is - which prices are rising? Since the pandemic, prices of food commodities have been on an upward trend, rice is now 45 percent more expensive per metric ton, chicken is 39 percent higher per kilo, and wheat, while down from the dramatic increase of over 100 percent is 16 percent higher. These are trading prices as opposed to the price consumers actually pay. Average consumer food prices have been above CPI levels, with the GDP-weighted average increase in 2022 at 7.8 percent and this year at 7.7 percent.
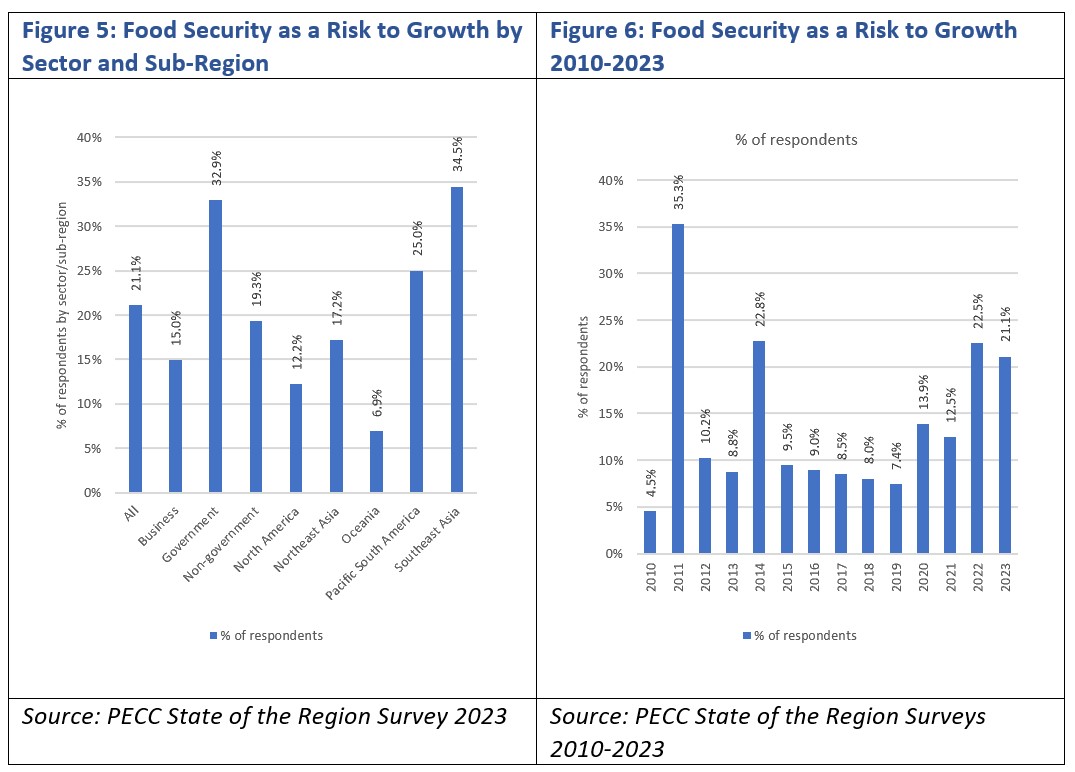
Although food security was not in the top 5 list of risks overall, there were some substantial differences among sub-regions. As shown in Figure 5, over a third of respondents from Southeast Asia selected food security as a risk to growth making it the fifth highest. While for Oceania only 6.9 percent selected food security as a top risk, making it only the eighteenth highest risk. The overall percentage of respondents who selected food security as a top 5 risk to growth was at its highest level since the 2011 food price crisis. That came in the immediate aftermath of the Global Financial Crisis, that price hike pushed an estimated 44 million people into poverty.[2] The Bank estimates that trade policies such as export bans were responsible for 45% of the run-up in the international rice price and for 30% of the wheat price increase in the 2008 crisis. Given APEC’s focus on trade, these issues need to be monitored carefully given the precarious situation for many of the region’s economies.
Section 3: Rising Concerns Over Climate Change
Over the past 4 years, a rising percentage of respondents to PECC’s annual State of the Region survey has expressed concerns over the risk that climate change poses to economic growth. An inflection point occurred during the pandemic with an almost doubling of those who picked climate change as a top 5 risk to growth for their economy. In 2020, APEC adopted the Putrajaya Vision 2040, which includes as one of its key objectives the promotion of policies and growth that support global efforts to comprehensively address all environmental challenges, including climate change, extreme weather and natural disasters. This goal has been further articulated in the Aotearoa Plan of Action in 2021 and the Bangkok Goals on the Bio-Circular-Green (BCG) Economy (Bangkok Goals) which consolidated much of the ongoing work to promote more sustainable growth in the region.
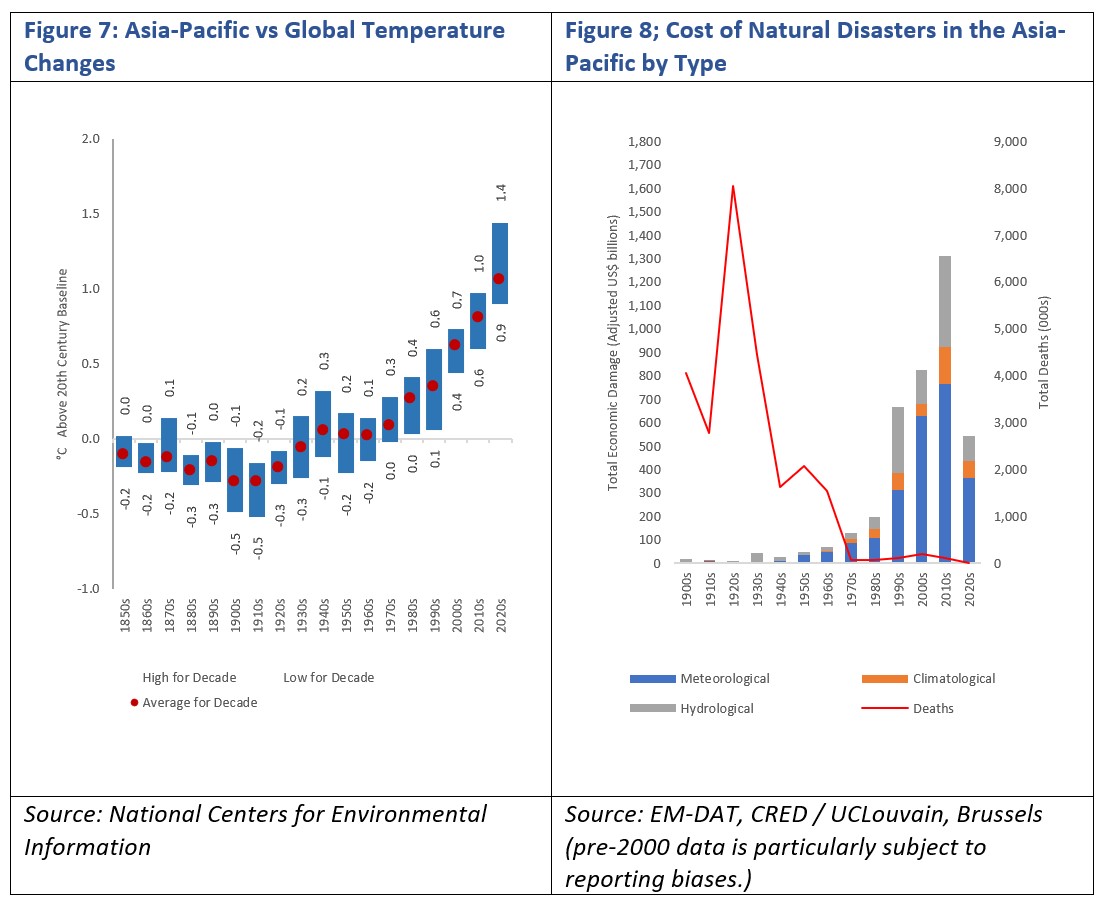
The challenge facing the region is formidable. The Bangkok Goals include concrete initiatives to transition to a climate resilient future aligned with global efforts such as the Paris Agreement, the central aim of which is to keep global temperature rises well below 2°C above pre-industrial levels and limit the increase even further to 1.5°C. Figure 7 shows the highest, lowest and average temperature per decade above the baseline for the 1901-2000 period for the world.[3] While average temperatures for each decade tended to be cooler during the 1850-1900 period than the 20th century baseline, post-1970 every decade has been warmer. Furthermore, there has been an upward trend in the average temperature every decade, with no year during the 2010s and 2020s below the average for the preceding century.
As shown in Figure 8, the cost of natural disasters (meteorological, climatological, and hydrological – excluding other natural disasters such as geological such as earthquakes and volcanic eruptions) has been increasing over the past century, from an average per decade of under US$100 billion (adjusted for inflation) to levels exceeding US$500 billion since the 1990s. The good news is that the total number of deaths from natural disasters has largely been decreasing. Moreover, the number of natural disasters in the region has also been increasing from an annual average of just under 13 from 1910-1979 to close to 126 from 1980 onwards. As noted, pre-2000 data is subject to reporting bias, and better record keeping is likely to increase figures, nonetheless, the general trend is towards an increased frequency. While the economic cost has been increasing, the data also shows that the number of deaths from the same types of natural disasters in the Asia-Pacific has dropped from as high as 8 million during the 1920s to 121,000 in 2000.
APEC’s has a long history in concrete and practical initiatives albeit within its non-binding principle. This includes work on environmental goods – defining and reducing barriers to their trade to reduce adoption costs, agreements to double the use of renewables in the energy mix from 2010 levels by 2030 and reduce energy intensity by 45 from 2005 levels by 2035.
Updating these goals was the 4th highest on the list of priorities for APEC’s Leaders’ discussion in San Francisco. However, the survey also reveals some significant differences among stakeholders and gender on how important they think this issue is. Business respondents ranked updating the goals 7th while it was the top priority for government respondents. There were also differences in perspective by gender on this issue, with female respondents ranking it 1st and males 5th.
One area where practical initiatives could be taken is to facilitate the increase in investment in renewable energy in emerging economies. Data from the IEA suggests that investment in renewables is now far larger than other energy sources, rising from 53 percent of the total pre-pandemic to 62 percent. As shown in Figure 9, the levels are far higher for advanced economies at 82 percent compared to 63 percent in emerging markets.
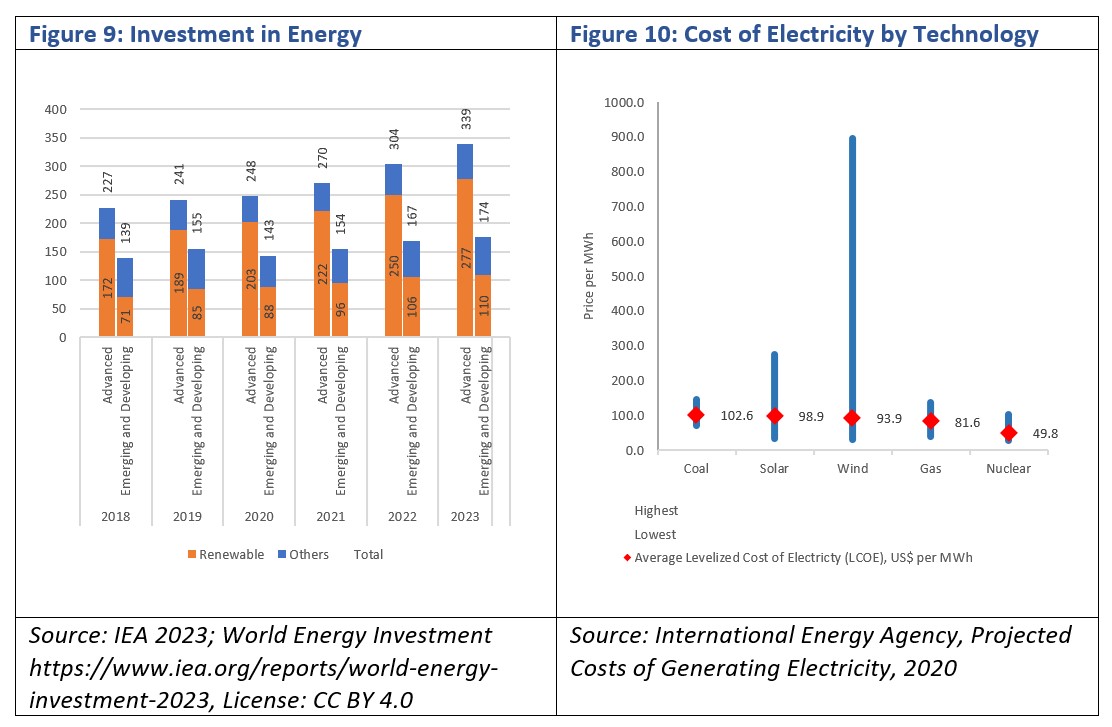
Moreover, while the levelized cost of energy (LCOE) from renewables has come down in recent year and is, on average competitive with traditional fuels, among a sample of prices from the International Energy Agency, there is a much wider difference between the highest and lowest costs, even taking into account, a carbon price of US$ per ton. What lies behind these large differences could make a significant difference to wider adoption, especially for the region’s emerging economies and jurisdictions where either a mandatory carbon is not set or if subsidies or tax credits are not available.
Section 4: Rising Protectionism and Geo-Economic Fragmentation
Increased protectionism and trade wars as well as geo-economic fragmentation were top 5 risks with 36 and 39 percent respectively selecting them as potentially slowing economic growth for their economies. While geo-economic fragmentation is a new risk in the survey, rising protectionism has been included in the list of risks since the post-Global Financial Crisis period. At that time the fears were over ‘creeping protectionism’ but strong political commitments in statements from both APEC and G20 leaders signalled a desire on the part of governments to avoid a Great Depression-style situation with tit-for-tat actions taken to ‘protect’ citizens ultimately deepening the damage done to economies and livelihoods.
At the G20 meeting in Pittsburgh in 2010, Leaders made the commitment to ‘keep markets open and free and reaffirm the commitments made in Washington and London: to refrain from raising barriers or imposing new barriers to investment or to trade in goods and services, imposing new export restrictions or implementing World Trade Organization (WTO) inconsistent measures to stimulate exports and commit to rectify such measures as they arise. We will minimize any negative impact on trade and investment of our domestic policy actions, including fiscal policy and action to support the financial sector.’ That same year, APEC Leaders made a similar statement, ‘[i]n our continued efforts to resist protectionism, we agree to extend our commitment on standstill made in 2008 to the end of 2013 to refrain from raising new barriers to investment or to trade in goods and services, imposing new export restrictions, or implementing World Trade Organization inconsistent measures in all areas, including those that stimulate exports. We commit to take steps to rollback trade distorting measures introduced during the crisis. Furthermore, we will continue to exercise maximum restraint in implementing measures that may be considered to be consistent with WTO provisions if they have a significant protectionist effect and promptly rectify such measures where implemented’.
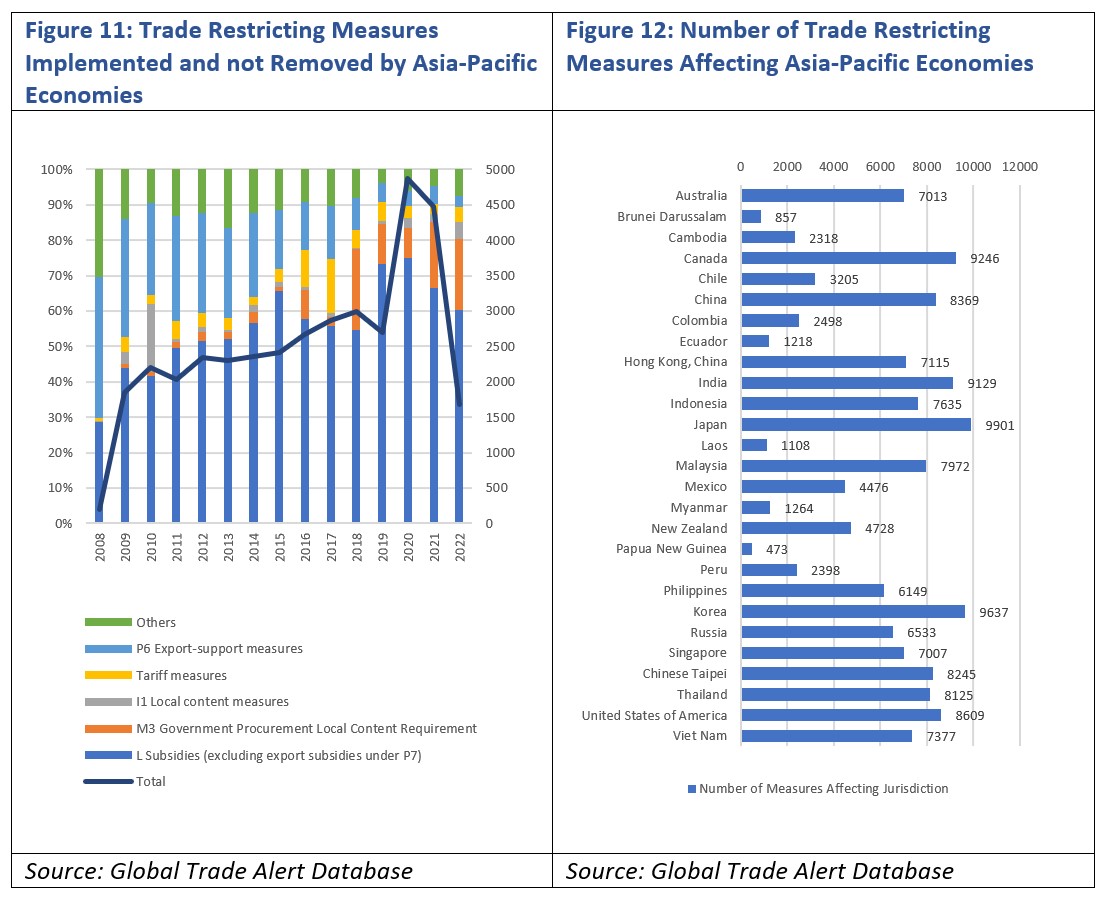
In spite of having made these commitments, since the Global Financial Crisis, Asia-Pacific economies have implemented and not withdrawn on average about 1,295 trade restricting measures a year, or a total of over 18,000. While this has come down from the peaks reached in 2020 during the pandemic this is still high and damaging unless some commitment and clarity is reached on how to stop this trend. Perhaps more important is the type of measures governments have been implementing. In the aftermath of the Global Financial Crisis, subsidies made up around 40 percent of the trade-restricting measures Asia-Pacific governments were adopting, even before the pandemic they reached 60 percent of measures, before rocketing up to above 70 percent in 2020, this has come back down to 60 percent, but they remain worrying high given the notorious lack of clarity on what constitutes a ‘WTO inconsistent measure.’
While having an expectation that Asia-Pacific economies might lead the way in a return to discipline on trade policy, they have faced a disproportionate number of trade-restricting measures themselves. On a simple count, regional economies still face a total of 641,306 measures that restrict their trade. Some policies affect multiple jurisdictions and others are multi-dimensional – that is – include a variety of instruments such as subsidies, loan guarantees and tariffs for example.
In more recent years, Leaders commitments have become less clear on the political commitment to avoiding protectionism – such as “deliver a free, open, fair, non-discriminatory, transparent, inclusive and predictable trade and investment environment.”
This has become an issue of concern in recent years. Close to 40 percent of respondents to PECC’s annual survey selected slower trade growth as a risk to economic growth for their economy. Most concerned were respondents from Northeast Asia with 46 percent of respondents selecting it as a top 5 risk, with North Americans the least concerned at 27 percent. This is likely connected to the significance that trade plays in the overall economy a much more significant role in all Asian economies. Importantly, among different stakeholder groups, 44 percent of business respondents selected slower trade growth as a risk compared to 38 percent of government.
While there are many factors in play with the slowdown in trade growth in the region, as shown in Figure 13, compared to the first two decades of the 21st century, trade is currently expected to play much less of a role in driving overall aggregate demand. This inflection point occurred after the Global Financial Crisis, with trade growth below overall GDP growth for a number of years. That pattern looks likely to continue for the foreseeable future.
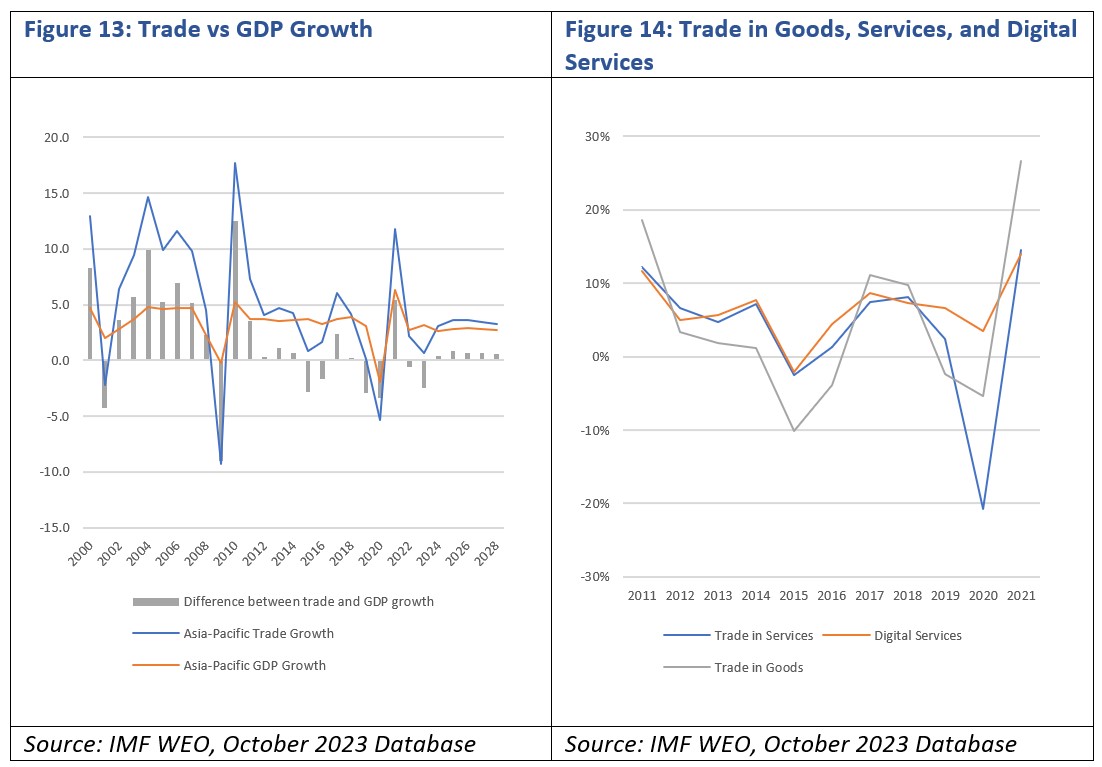
There is, however, a lot of potential in trade in digitally delivered services. As shown in Figure 14, over the 10-year period from 2011-2021, trade in digitally delivered services has been growing on average at about 2 percentage points faster than trade in goods and close to 3 percentage points faster than services.
Among APEC members, digital trade increasingly features in trade agreements with some part of broader agreements and other standalone. Finding consensus and balance on often contentious issues will be essential to further fostering digital trade, especially with a view to the potential it has to make markets more open to micro, small and medium-sized enterprises that previously were unable to trade internationally. However, the risk of fragmentation in trade rules remains real and that could increase transaction costs, especially regulatory compliance. While larger firms are able to absorb these costs, smaller firms are far less likely to have internal teams of compliance officers or able to afford outside assistance. Where APEC can add value to existing agreements such as the Comprehensive and Progressive Trans-Pacific Partnership (CPTPP), the Regional Comprehensive Economic Partnership (RCEP), and the Digital Economy Partnership Agreement (DEPA), is to strengthen experience and model sharing in cross-border electronic payment, internet finance, digital assets and cybersecurity with the help of digital technology. [4]
Section 5: Towards an Inclusive Recovery
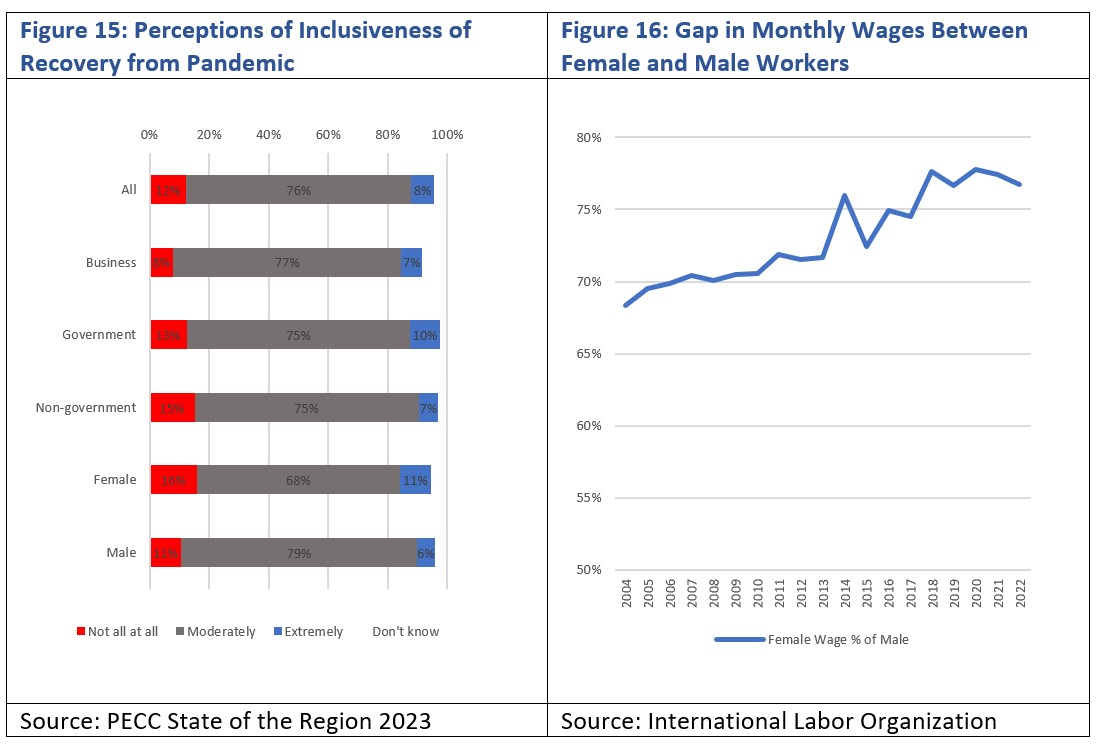
One of the key drivers of achieving the Putrajaya Vision is ‘strong, balanced, secure, sustainable and inclusive Growth’, the Aotearoa Plan of Action specifies that the region’s growth should be high quality and inclusive, bringing palpable benefits and greater health and wellbeing to MSMEs, women and others with untapped economic potential. However, the achievement of that goal has been severely hampered by the pandemic. According to PECC’s 2023 survey, only 8 percent of respondents think that the recovery has been ‘extremely inclusive’ while 76 percent think it has been moderately so. While ‘extremely inclusive’ may be setting a high benchmark, APEC Leaders’ own objective is to achieve a more inclusive region.
Perceptions of the inclusiveness of the recovery were fairly similar across stakeholder groups with similar percentages saying that the recovery had been moderately inclusive, however there were differences at the ends of the spectrum. For example, while 15 percent of non-government and 13 percent of government respondents thought the recovery had been ‘not at all inclusive’, businesses tended to be less critical. There were some distinct differences between female and male respondents. Males were more likely to say that the recovery was moderately inclusive while females were likely to be at both ends of the spectrum.
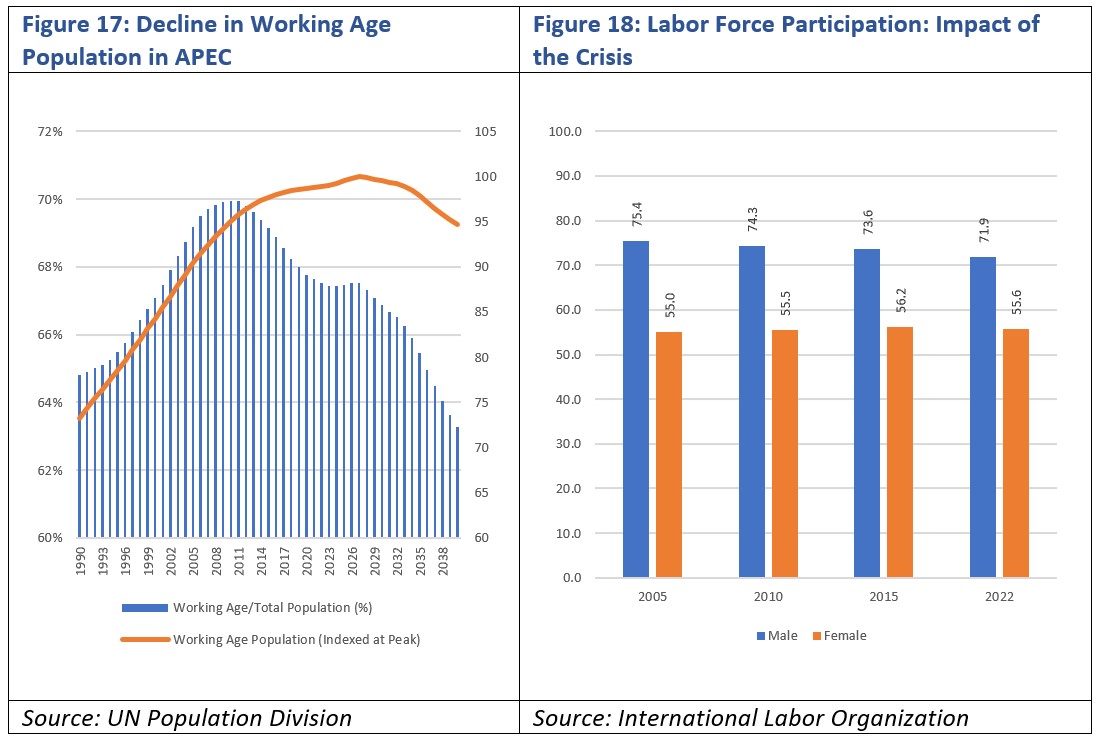
Data from the ILO shows that although the gap in wages between female and male workers has narrowed from an average of around just 68 percent of their male counterparts to t to 77 percent, the closing of that gap stalled over the pandemic and is yet to regain momentum.
Furthermore, on a simple average basis, the labor force participation rate among regional economies declined between 2015 and 2022, i.e., the period covered by the crisis. Several APEC economies are experiencing tight labor markets as a result of this. The problem of lower labor force participation and its impact on overall growth may become greater over the next couple of decades. For APEC’s 21 members, the working age population is expected to peak in about 2027, while the working age population as a percentage of the total population already peaked in 2010. As APEC members both individually and collectively strive to achieve the Putrajaya Vision, addressing this will be essential to the achievement of the vision.
There are many ways of thinking about inclusion, and rarely do any two people agree on which definition to use. The Aotearoa Plan of Action talks about building on APEC’s Agenda on Advancing Economic, Financial and Social Inclusion to enhance economic inclusion for all, in which Leaders’ clearly expressed concerns over the state of affairs in the region, noting that “Expanded trade and investment and digital transformation have spurred significant economic growth and employment, but the gains have been spread unevenly to different segments of our societies.”
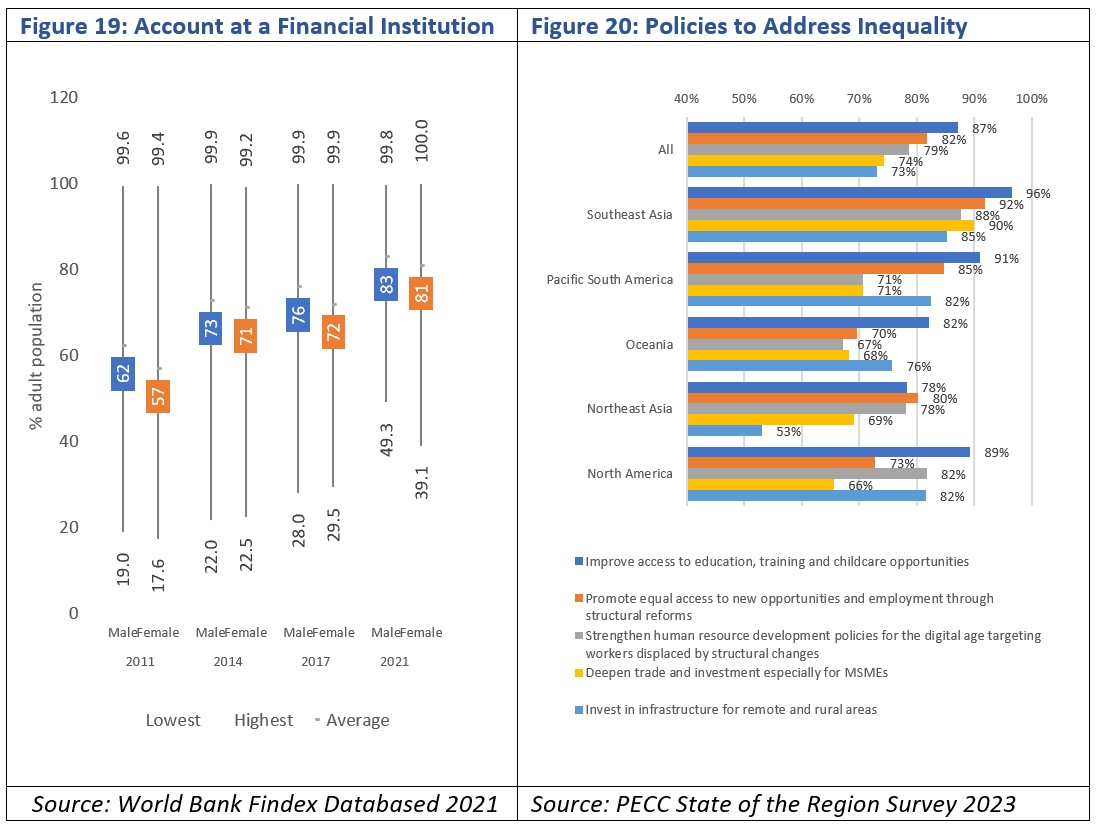
One of the concrete actions is to promote financial products and services appropriate for the unserved and underserved financial consumers, especially those from rural areas and the agricultural sector. Another way of looking at the inclusion issue is through the gender lens.
However, Figure 19 also shows that there remains a significant gap in those with a financial institution between those with an account and those without for both males and females. For a number of economies, all of the adult population (males and females) have an account at a financial institution. The rapid adoption of mobile money has the potential to increase financial inclusion, making previously unreachable customers connected to the financial system. In East Asia and the Pacific there are now about 361 million registered mobile accounts and globally 1.6 billion.
When asked what governments should do to make growth more inclusive moving forward, respondents tended to select issues related to education. The top 5 were:
- Improve access to education, training and childcare opportunities;
- Promote equal access to new opportunities and employment through structural reforms;
- Strengthen human resource development policies for the digital age targeting workers displaced by structural changes;
- Deepen trade and investment especially for MSMEs; and
- Invest in infrastructure for remote and rural areas.
Different sub-regions of the Asia-Pacific tended to emphasize different issues. For example, the top 3 for North American respondents were:
- Improve access to education, training and childcare opportunities.
- Strengthen human resource development policies for the digital age targeting workers displaced by structural changes; and
- Invest in infrastructure for remote and rural areas.
While for Southeast Asians the top 3 were:
- Improve access to education, training and childcare opportunities;
- Promote equal access to new opportunities and employment through structural reforms; and
- Deepen trade and investment especially for MSMEs.
For respondents from Pacific South America, the top 3 were;
- Improve access to education, training and childcare opportunities;
- Promote equal access to new opportunities and employment through structural reforms; and
- Invest in infrastructure for remote and rural areas.
Figure 21 provides a breakdown by sub-region of what respondents thought governments should do to make growth more inclusive.
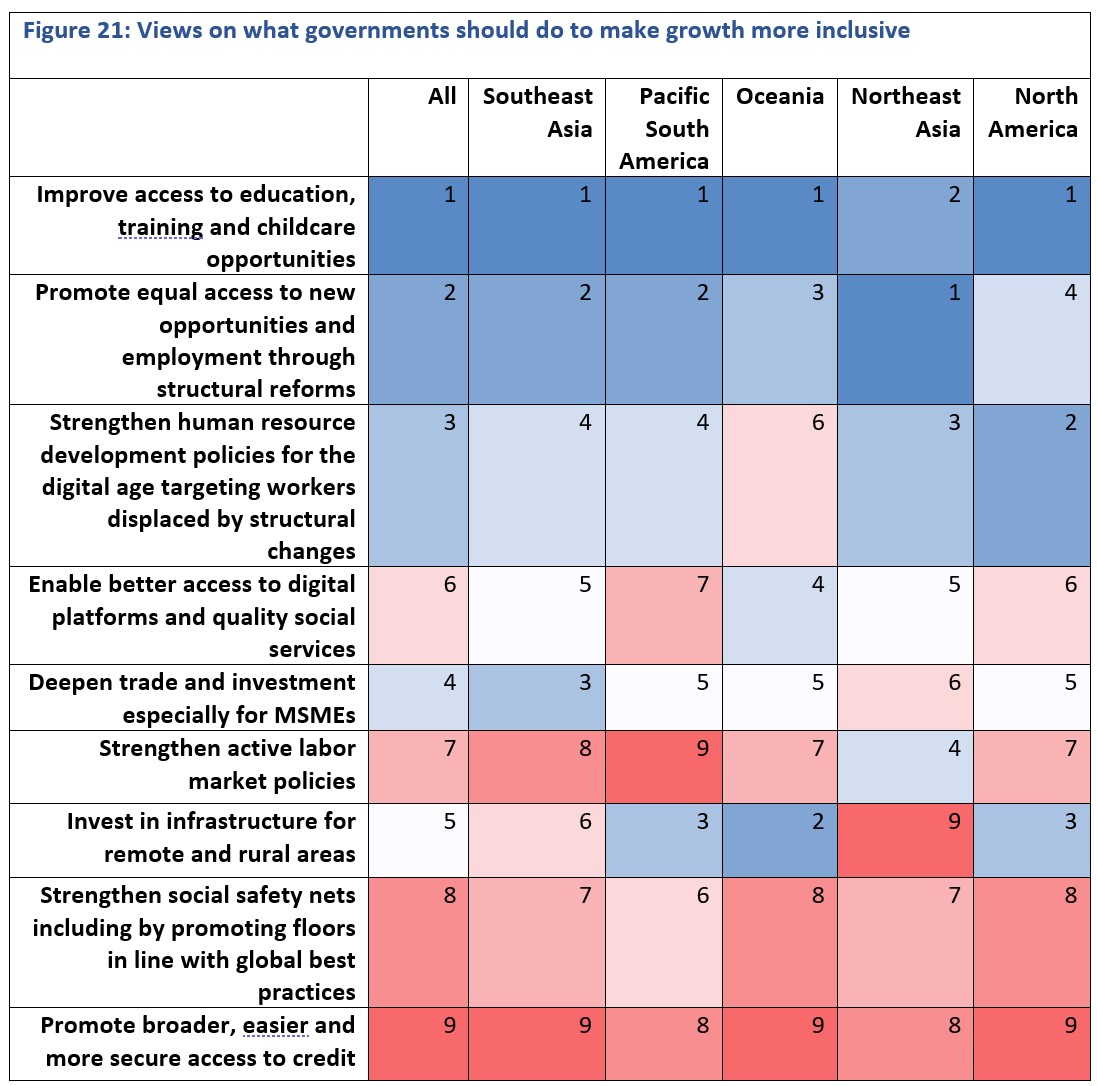
Education, training, and childcare as well as and human resource development to assist worker displaced by changes taking place during to the digital transformation both ranked within the top 5 for the sub-regions in the Asia-Pacific. However, as shown in Figure 21, looked at by sub-region, there were considerable differences in emphasis. For example, investing in infrastructure for remote and rural areas ranked in the top 3 for Pacific South America, Oceania and North America, but was lower down the list for Southeast and Northeast Asia. These differences should not be surprising given the diversity of economies in the broad Asia-Pacific, but the results also suggest that on some issues such as improving access to education, training and childcare opportunities, there is broad consensus and more ambitious work can be done. This is also the case for promoting equal access to new opportunities and employment though structural reforms. For other issues, there needs to be more dialogue and consensus building.
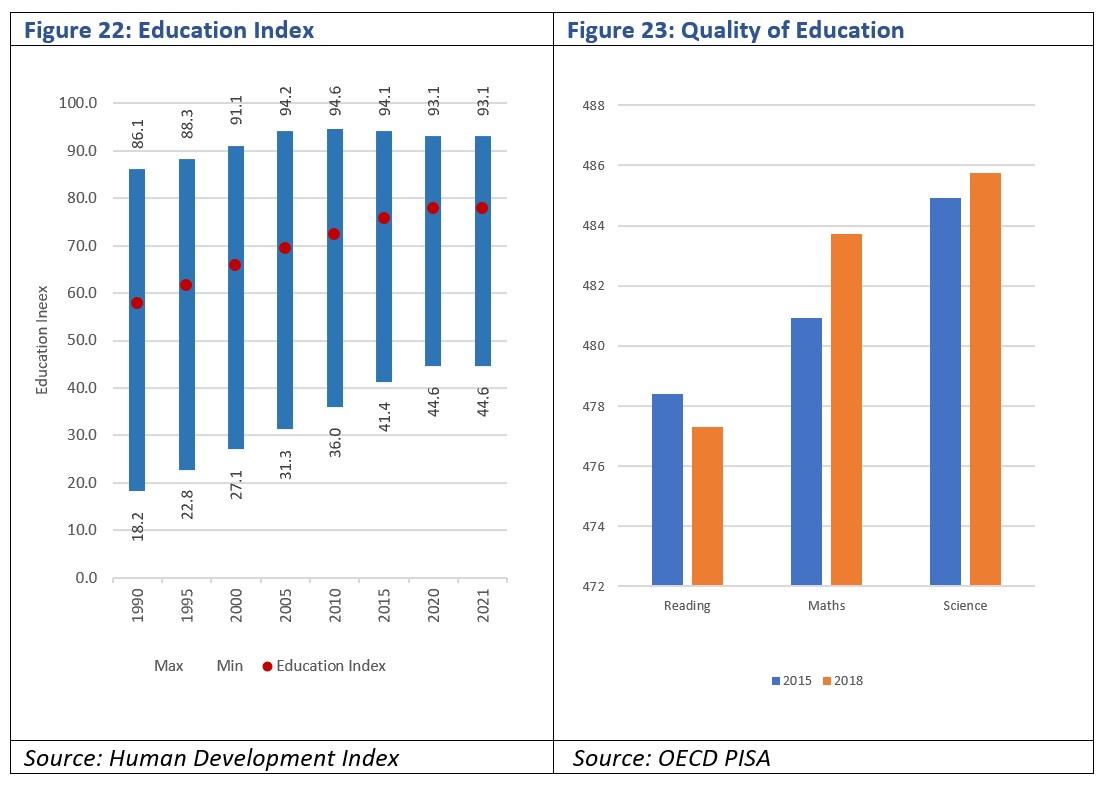
It should come as no surprise that education issues topped the list given the impact of the pandemic on education. UNICEF estimates that school closures affected more than 1.6 billion learners with full and partial school closures lasted an average of 224 days.[5] Early estimates were that the pandemic would cost the ‘pandemic’ generation of students around $10 trillion in lifetime earnings in present value in the intermediate scenario or in the worst case as much as $16 trillion.[6] Figure 22 shows the average education index using data from the UNDP Human Development Index, while there has been a general trend towards improvement in terms of the number of years of schooling received by children, this has stalled in recent years, with the minimum value among APEC members decreasing significantly during the pandemic. While Figure 22 looks at the number of years of education received, Figure 23 looks at the ‘quality’ of education using the average Programme for International Student Assessment (PISA). PISA measures 15-year-olds’ ability to use their reading, mathematics and science knowledge and skills to meet real-life challenges.
Beyond looking at specifically disadvantaged groups, the general conditions in the region fare little better. Over the course of the past 30 years, the income shares of both the bottom two deciles as well as the middle deciles has dropped. As shown in Figure 24 the share of the bottom two deciles, has decreased from 6.2 percent of total income to 5.6 percent, while the income share of the top two deciles has increased from 43.8 percent to 46.4 percent. If current trends continue, the trend will only get worse. Having said that, there is tremendous promise in the region with a rising middle class emerging - that is those earning between US$10 and US$100 a day has increased over the past 30 years from 822 million to over 2 billion[7]. The promise in this is that the region will be less prone to imbalances with a new consumer class in the region’s emerging and developing economies. This assumes average growth rates in the region of 3.3 percent from 2020-2030 and 2.9 percent from 2030-2040 and that the current income share per decile remains the same. But as discussed above, the average growth rate is now closer to 2.6 percent. At the same time given APEC’s goals for inclusion, it is concerning there will still be 7 million people living at under US$10 a day. Moreover, these are averages, doubtless there are those earning considerably less even within the lower deciles.
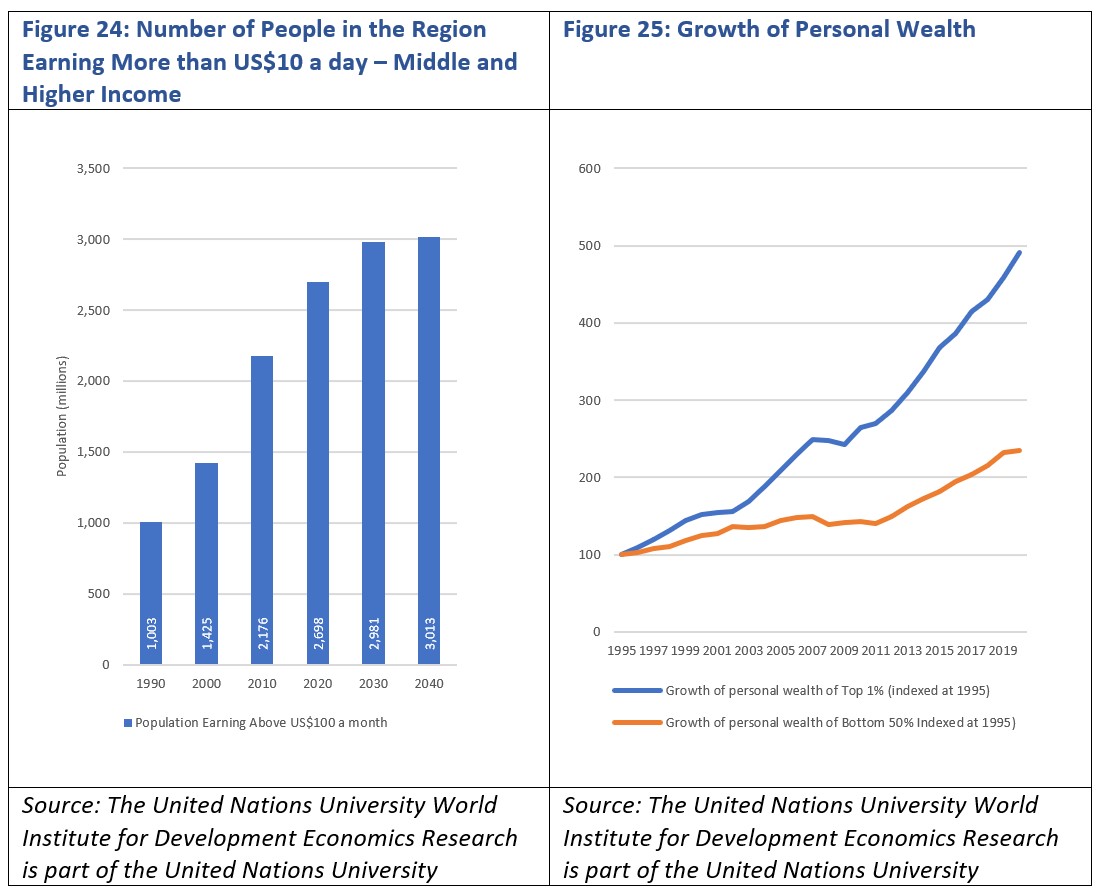
Another good news-bad news story is personal wealth. While the total wealth people in the region is growing, for example the personal wealth of the bottom 50 percent has more than doubled since 1995, the personal wealth of the top 1 percent is growing at a much faster rate. As a comparison, the average personal wealth of someone in the bottom 50 percent (half of the population) has grown from just PPP6000 to close to PPP14,000m for the top 1 person it has risen from PPP1.2 million to PPP5.5.
Section 6: Towards More Inclusive Trade
While SMEs represent about 90 percent of businesses and account for more than 50 percent of employment, they are far less likely to be able to obtain loans. The International Finance Corporation (IFC) estimates that 40% of formal micro, small and medium enterprises (MSMEs) in developing countries, have an unmet financing need of $5.2 trillion every year equivalent to 1.4 times the current level of the global MSME lending with economies in the Asia-Pacific accounting by far for the global finance gap.[8] As discussed above and shown in Figure 21 respondents from Southeast Asia tended to place a higher degree of importance to deepen trade and investment especially for MSMEs.
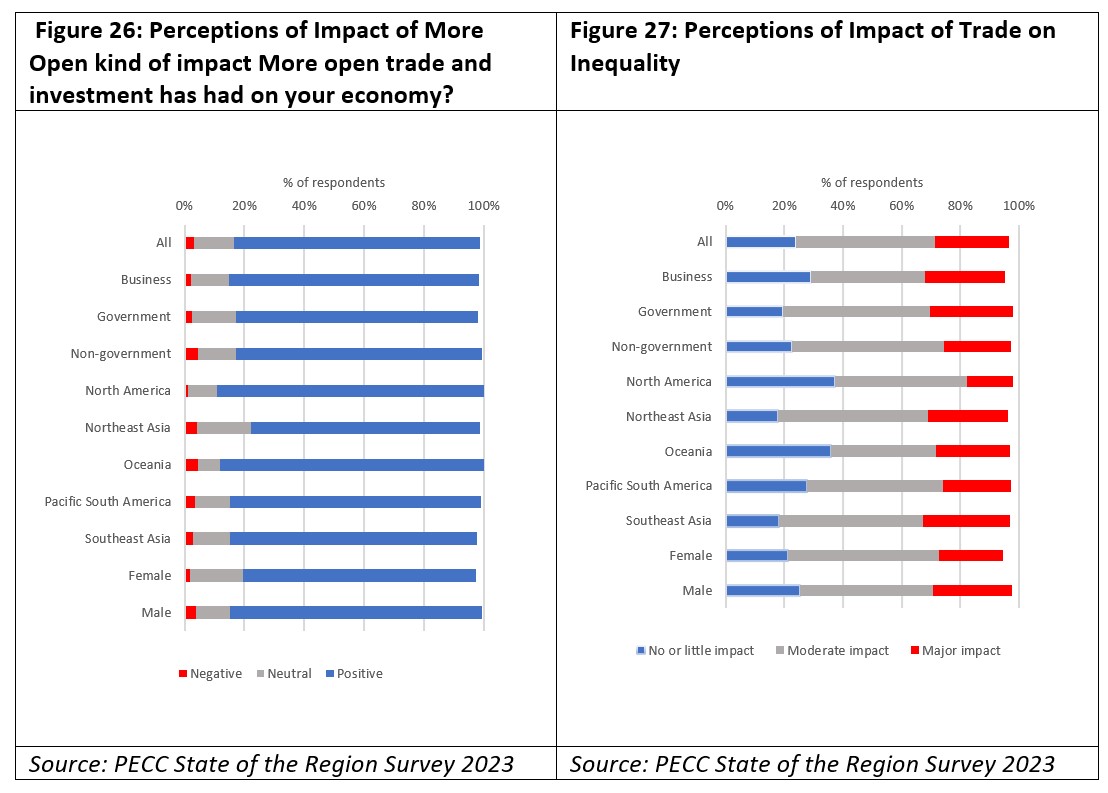
Although respondents to the survey tended to have a positive view on the impact of more open trade and investment on their economies, a significant percentage also think that trade with other economies has a moderate to major impact on inequality. Respondents from North America tended to be the most positive about the impact of trade on their economies while Southeast Asians had the highest share of respondents who believe that trade has a moderate to major impact on inequality.
Given the proliferation of trade agreements, partnerships and frameworks in the region it is concerning that low percentages of respondents believe that stakeholders beyond business and legislative bodies are regularly consulted in the formulation of their government’s trade policy. While 55 percent of respondents think that consultation with business is ‘just right’, only 25 percent think that it is ‘just right for consultation with organized labor. Given the emphases that APEC places on MSMEs, overall 19 percent of respondents believe that MSMEs are ‘not at all’ consulted, and 21 percent think that it is just right. Greater experience sharing among APEC members on the mechanisms used to consult different stakeholder groups would be valuable in efforts to create greater support for trade as well as responding to concerns.
Trade issues remain a top concern for respondents with the focus shifting somewhat towards supply chain resilience in light of the disruption to them during the pandemic. Reflecting concerns about increased protectionism, slower trade growth, and fragmentation, respondents placed a high priority on supporting the multilateral trading system and the WTO. They tended to not see regional initiatives such as the Free Trade Area of the Asia-Pacific and support for the global trade system as mutually exclusive, with many respondents selecting both as a top priority. However, business respondents to be the strongest advocates for a region-wide trade deal that would bring together the region under a single trading system.
However, in their view, the top issue – that perhaps underpins progress on all of the others is ameliorating geopolitical and trade conflicts in the region which has been the top issue for a number of years. APEC as a non-binding dialogue forum on which its members, nonetheless, are striving to achieve a common goal provides an ideal mechanism for regional economies to have open exchanges on contemporary issues of concern.
[1] WHO Director-General's opening remarks at the media briefing – 5 May 2023, https://www.who.int/news-room/speeches/item/who-director-general-s-opening-remarks-at-the-media-briefing---5-may-2023
[2] World Bank, Food Security Fears Rise Along with Prices, https://www.worldbank.org/en/news/feature/2011/04/01/food-security-fears-rise-along-with-prices
[3] This chart shows the divergence from the baseline for the 20th Century, while the Paris target is for pre-industrial levels.
[4] Challenges and Opportunities for Asia-Pacific Regional Economic Cooperation in the Post Pandemic Era, PECC, 2023
[5] https://www.unicef.org/reports/state-global-education-crisis
[6] Op cit
[7] There are many definitions of what ‘middle income’ is – see for example: Richard Reeves at al, “Defining the middle class: Cash, credentials, or culture?’ Brookings, 2018., https://www.brookings.edu/articles/defining-the-middle-class-cash-credentials-or-culture/
[8] World Bank, Small and Medium Enterprises (SMEs) Finance: Improving SMEs’ access to finance and finding innovative solutions to unlock sources of capital.