Chapter 4 - Annual Report of the Composite Index of Economic Integration in the Asia-Pacific Region: 1990 ~2011*+
*Contributed by Bo Chen Shanghai University of Finance and Economics, and Asia Pacific Foundation of Canada. 100 Wudong Rd., Yangpu District, Shanghai, China, 200433. Email: This email address is being protected from spambots. You need JavaScript enabled to view it.
+ For approach details, data sources and treatment, please refer to Bo Chen and Yuen Pau Woo (2010), “Measuring Economic Integration in the Asia-Pacific Region: A Principal Components Approach”, Asian Economic Papers, Vol.9(2), pp 121-143.
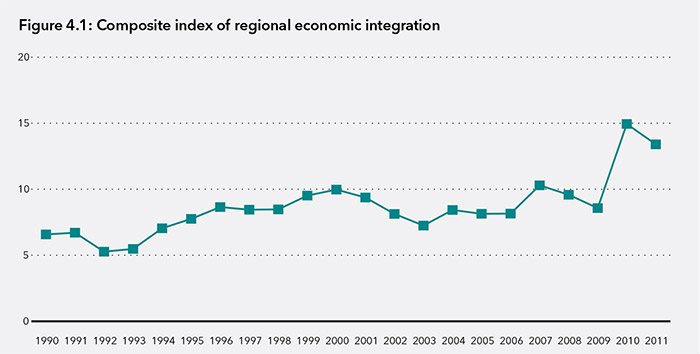
The economic integration of the Asia-Pacific region has rebounded since last year’s update to the index. This rebound follows declines in the index during the Global Economic Crisis.
The index measures the degree of integration taking place in the Asia-Pacific region based on intra-regional flows of: goods; investment; and tourists and five measures of convergence: GDP per capita; share of non-agriculture to GDP; the urban resident ratio; life expectancy; and share of education expenditure in GNI.
The index was developed in 2008 as a tool to measure the degree of integration taking place in the Asia-Pacific. Regional economic integration has become a core objective of the Asia Pacific Economic Cooperation (APEC) forum. The process of economic integration is commonly defined as the freer movement of goods, services, labor, and capital across borders.
The degree of economic integration can be analyzed at bilateral, regional, and global levels. Even though the Asia-Pacific region is not covered by a single trading agreement, there is much anecdotal evidence to suggest that it is becoming more integrated. As defined by APEC membership, the region consists of not only developed economies such as the US, Japan, Canada, and Australia, but also emerging markets such as the ASEAN economies. It is well known that parts of the region are already highly integrated through production networks that facilitate trade of intermediate and finished goods across borders. Since 1998, many economies in the region have negotiated bilateral and subregional free trade agreements with partners in the region as well as outside the region. From 2004, APEC leaders began formally discussing a Free Trade Area of the Asia Pacific (FTAAP) and in 2010 agreed to take concrete steps towards its realization. If and when successful, FTAAP would constitute the largest regional trading bloc in the world.
An important feature of the index is that it excludes trade and investment flows among geographically contiguous sub-regional trading partners, namely NAFTA, the ASEAN Free Trade Area, and Australia-New Zealand Closer Economic Relations. It also excludes flows between China, Hong Kong (China), and Chinese Taipei. This is to control for the effect that sub-regional flows may have on the index, whereby a very high degree of integration among, for example, NAFTA economies could result in a falsely high measure of integration with the Asia-Pacific region as a whole.
Furthermore, since the trade, investment, and tourism measures are calculated relative to global transactions, the index will rise for a given economy only if that economy’s share of trade/ investment is growing relative to total trade and investment.
The weights given to each dimension are determined using principal component analysis.(See Bo Chen and Yuen Pau Woo (2010), “Measuring Economic Integration in the Asia- Pacific Region: A Principal Components Approach,” Asian Economic Papers, Vol.9 (2), pp. 121-143.)
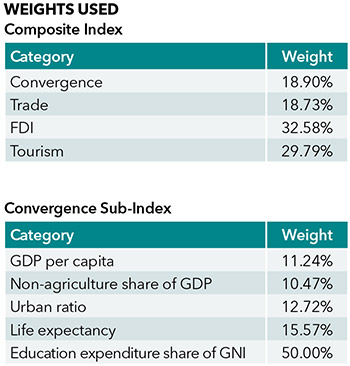
The convergence measures are premised on the notion that integration will lead to greater uniformity among the economies. Accordingly, more trade and investment among regional partners may not translate into a higher score on the integration index if at the same time the partners are diverging in terms of income, education, life expectancy, urbanization, and economic structure.
Caution should be exercised in the interpretation of these findings. The measures chosen for inclusion in the composite index are imperfect indicators of “convergence” and trade/investment integration. The rankings in turn should not be read normatively as “league tables” in the sense that a higher ranking is superior to a lower ranking. Indeed, a low ranking may simply indicate that an economy is more oriented globally than regionally, as is likely the case for China and the United States.
Nevertheless, the change in index value for a given economy over time can be read as a measure of its changing economic orientation. The index value for the region as a whole can also be seen as a measure of closer economic ties among Asia-Pacific economies and as one indicator of APEC’s success.
The 2014 update to the index is based on data from 2011. Missing data were approximated using standard interpolation and extrapolation techniques.
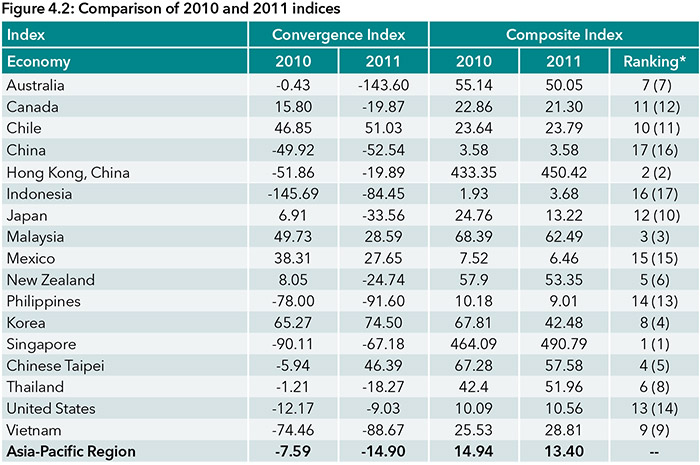
The index has reached its highest level over the twenty year period. After a sharp increase in 2010, the index declined again in 2011. It mainly results from weakening tourists (due to intra-regional political and military tensions) and declining convergence. The 2011 update to indices by economy shows how the overall integration process was suspended in 2011; as a result, 9 out of the 17 included Asia-Pacific economies decreased their levels of integration with the rest of the Asia-Pacific region.
Noticeably, Singapore and Hong Kong (China) are still the most integrated economies with the Asia- Pacific markets; their levels of integration increased respectively from 464 to 491 and from 433 to 450, compared to the previous update. As trading hubs in the region, Hong Kong (China) and Singapore have benefited the most from economic recovery in trade, investment, and tourism.
The two largest economies in this region, namely the United States and China, are still near or at the bottom in the ranking. It nevertheless indicates that they may be more integrated with other regional or sub-regional markets.
Asia-Pacific Trade Flows
Figure 4.3 shows the share of Asia-Pacific intraregional imports and exports to regional GDP. After various economic stimulus plans, regional economies showed some recovery in terms of intra-regional trade flows. Over the twenty-year period, intra-regional flows of exports and imports (over GDP) have increased from 11 percent to 13.4 percent. It should be re-emphasized here that this index discounts flows among sub-regions: the economies of Southeast Asia, North America and those among China, Chinese Taipei and Hong Kong, China.
The share of Asia-Pacific intra-regional merchandise trade recovered from the big hit in 2009 to pre-crisis levels of above 14 percent. However, it is still noted that China, Philippines, Malaysia, and Singapore showed slight decrease in the Asia-Pacific share of their total trade.
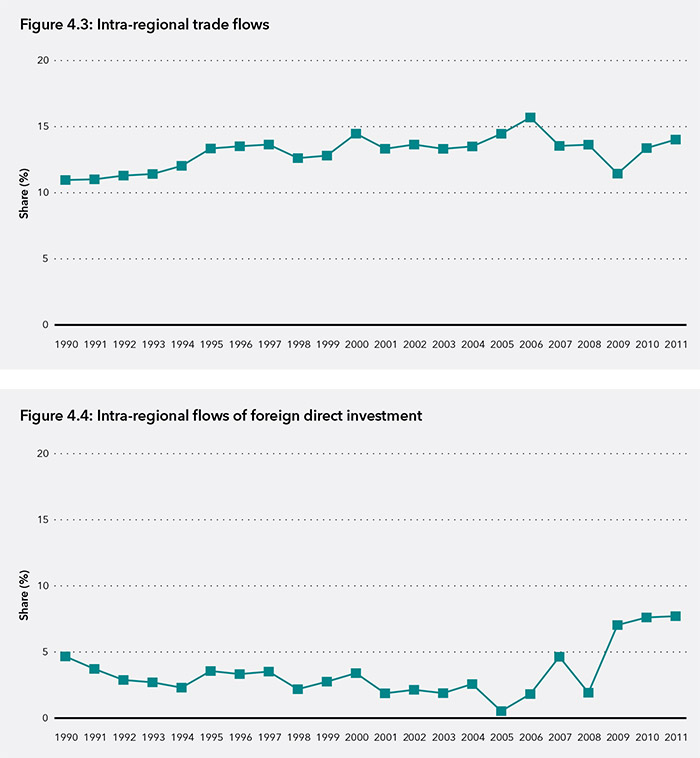
Foreign Direct Investment
Compared to flows of goods, intra-regional flows of investment show a much more erratic pattern. After the large decrease in FDI flows in 2008, they grew by over 200 percent year on year between 2008 and 2009, another 29 percent from 2009 to 2010, and more than 11 percent from 2010 to 2011. The biggest increases were for Japan, Singapore, and Australia, which contributed more than 75 percent of increment in the intra-regional FDI flows.
Tourism Flows
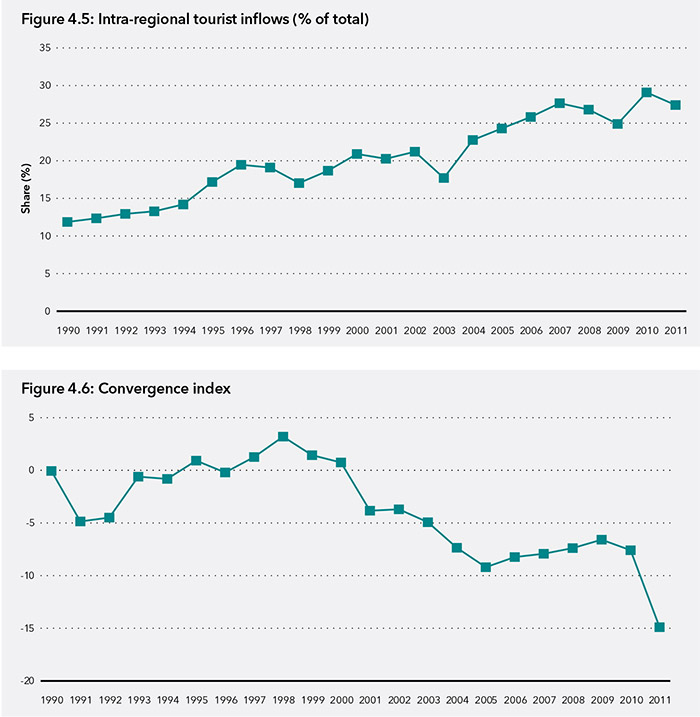
Figure 4.5 shows that the recovery of the intraregional tourism was not stable: according to the statistics, Figure 4.5 indicates that the intraregional tourist share (to every one thousand citizens in hosting economy of the sample) stops its rebound in 2010 but the overall level is still slightly higher than previous years.
From 2007 to 2009 the number of intra-regional tourist flows had been decreasing. However, in 2010, intra-regional tourist flows rebounded to close to 30 percent, the highest level recorded in our index. In 2011, the intra-regional tourist number dropped again but still remained significantly high.
Compared to 2010, the market with the biggest intra-regional tourist decline was Korea, followed by Japan, and the Philippines, which reported around 40 percent decline.
Convergence Index
The sub-index of convergence shows that economies in the region have continued their trend towards divergence. GDP per capita levels in the region had been converging somewhat during the crisis years. However, in 2010, divergence in incomes began once again and continued into 2011. It should be noted here that GDP per capita accounts for just 15 percent of the weight of this sub-index while education expenditure accounts for 50 percent of the weight. Shifts towards convergence in education, even minor ones would more than outweigh much larger shifts in income.
Diverging Incomes
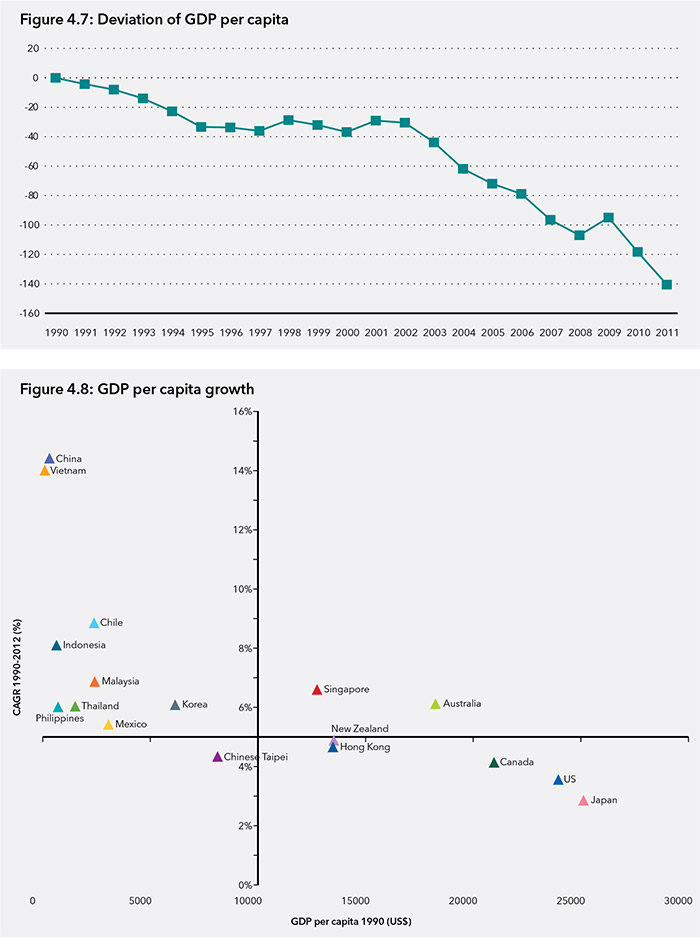
Figure 4.7 shows that the convergence indicator of real GDP per capita continued to decrease from 2009 into 2011 which reveals that the gap in real income among sample economies has resumed its diverging trend. This finding suggests that the richer economies (i.e. the US and Japan), which suffered from the recent global economic crisis more than the poorer ones (i.e. the Southeast Asian economies minus Singapore), have been recovering.
Over the whole index period, the divergence in incomes has been driven by differences in growth rates. In 1990, the average GDP per capita in the region was just below US$10,000; by 2011, it had increased to above US$25,000 or a growth rate of around 5 percent. However, income levels in some economies have grown at a much higher rate than the average in the region while others under the average.
Figure 4.8 plots compound annual growth of GDP per capita over the past 22 years against starting values in 1990. For a convergence in income to happen, lower-income economies need to grow at a substantially higher rate than those of higher income. While some economies such as China and Vietnam have posted very high growth rates in GDP per capita, others are only growing at rates similar to their richer counterparts. This explains the divergence seen in Figure 4.7.
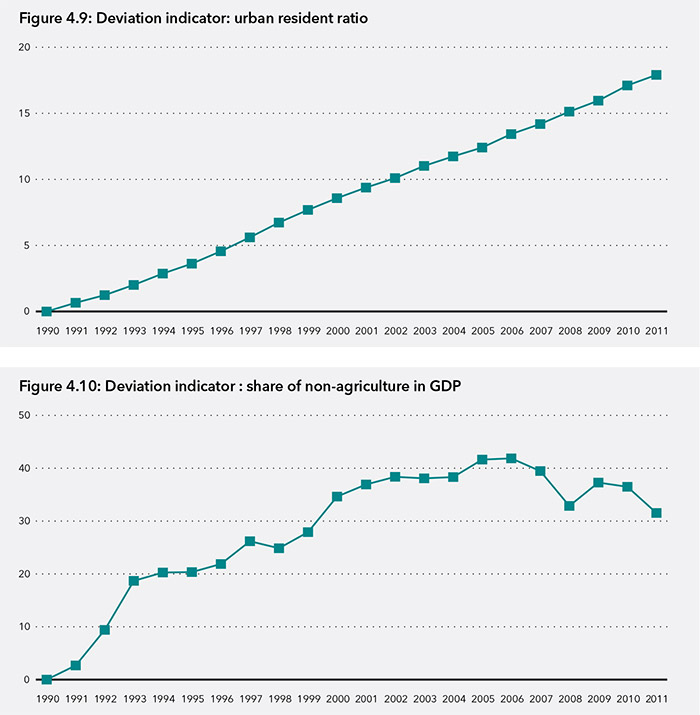
The pace of urbanization in the region has been steady throughout the period as represented by the percentage of population living in urban areas. In 1990, the urban resident ratio was 65 percent with a standard deviation of 22. By 2011, the urban resident ratio had increased to 73 percent with a standard deviation of 18, meaning that all economies are becoming increasingly urbanized at a similar rate. As seen in Figure 4.9, this has been a very linear trend with few interruptions to the process unlike the share of non-agriculture in GDP which has been much more volatile, and diverging since 2009.
As shown in Figure 4.9, the indicator of urban resident share is still steadily converging over time thanks to the ambitious urbanization process in developing economies such as China and Southeast Asia. Regardless of the last two years of divergence, the share of non-agriculture in GDP increased both on average and its convergence: in 1990 the average share of non-agriculture in GDP was 89 percent with a standard deviation of 8.2; over the next 21 years, the share of nonagriculture has steadily increased in the region and now accounts for 94 percent of total output with a standard deviation of 5.6.
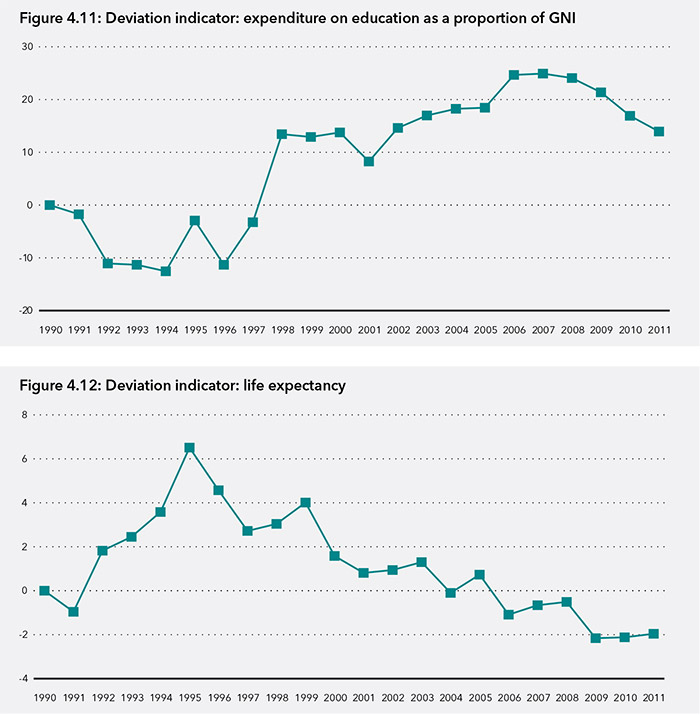
While the proportion of expenditure on education in the region has significantly risen over the past 22 years, Figure 4.11 shows that its level of convergence has declined since 2008. In 1990, the average expenditure on education as a percentage of gross national income was 3.6 percent; the latest data shows that average expenditure was around 4.2 percent of GDP.
In 1990, the average life expectancy in the region was 72.4 years; by 2011, it had increased by 5 years to 77.9, with a standard deviation of 3.6. As seen in Figure 4.12, between 1991 and 1995, life expectancies had been converging. However, the level of convergence began to decrease thereafter. The latest update to the index shows that the level of convergence in life expectancy in the region is even below the level in 1990. This means life expectancy is increasing faster in some economies than others.
When APEC Leaders set out the Bogor Goals in 1994, they set out a vision through which the region would not only maintain high growth rates but also narrow development gaps. While the region has done well in integrating and overall incomes have increased at a dramatic pace, the index shows that there is a long way to go in terms of closing development gaps. Integration is not an end in itself but a means to ensuring that all citizens can achieve their potential.