Chapter 3 - Perspectives on regional policy issues
CONTRIBUTED BY MR. EDUARDO PEDROSA, SECRETARY GENERAL OF PECC / COORDINATOR OF STATE OF THE REGION
The state of the region remains in flux. The regional policy community remains concerned about the prospects for future growth in the region and the risks coming from the failure to implement structural reforms. The region’s long-term vision of an integrated Asia-Pacific is at risk from increased protectionist sentiment and a deterioration of the political environment for further trade liberalization.
At the same time, the key policy issues are shifting from tariff to non-tariff barriers. As discussed in chapter 2, the importance of services to economic growth is increasing but as revealed in this year’s survey, while the policy community sees big benefits in the liberalization of the services sector in terms of cheaper and better services and overall competitiveness, policy reforms may be hampered by the lack of competitiveness of local firms. If progress is to be made, government officials need to make regulations more transparent and predictable, especially among multiple layers of authority. Rapid technological advances are making services increasingly tradeable but new issues are coming to the fore such as barriers to data flows. If inclusive regional growth is to be achieved, the Asia-Pacific needed to take significant steps to resolve these issues.
In 2006, the PECC took the decision to develop the Pacific Economic Outlook publication from a forecast of the regional economy to a broader look at the state of the region. A key component of the State of the Region report is a survey of the regional policy community including businesses, governments, academics, media and civil society. This chapter summarizes the key findings from the 2016 survey of the regional policy community.
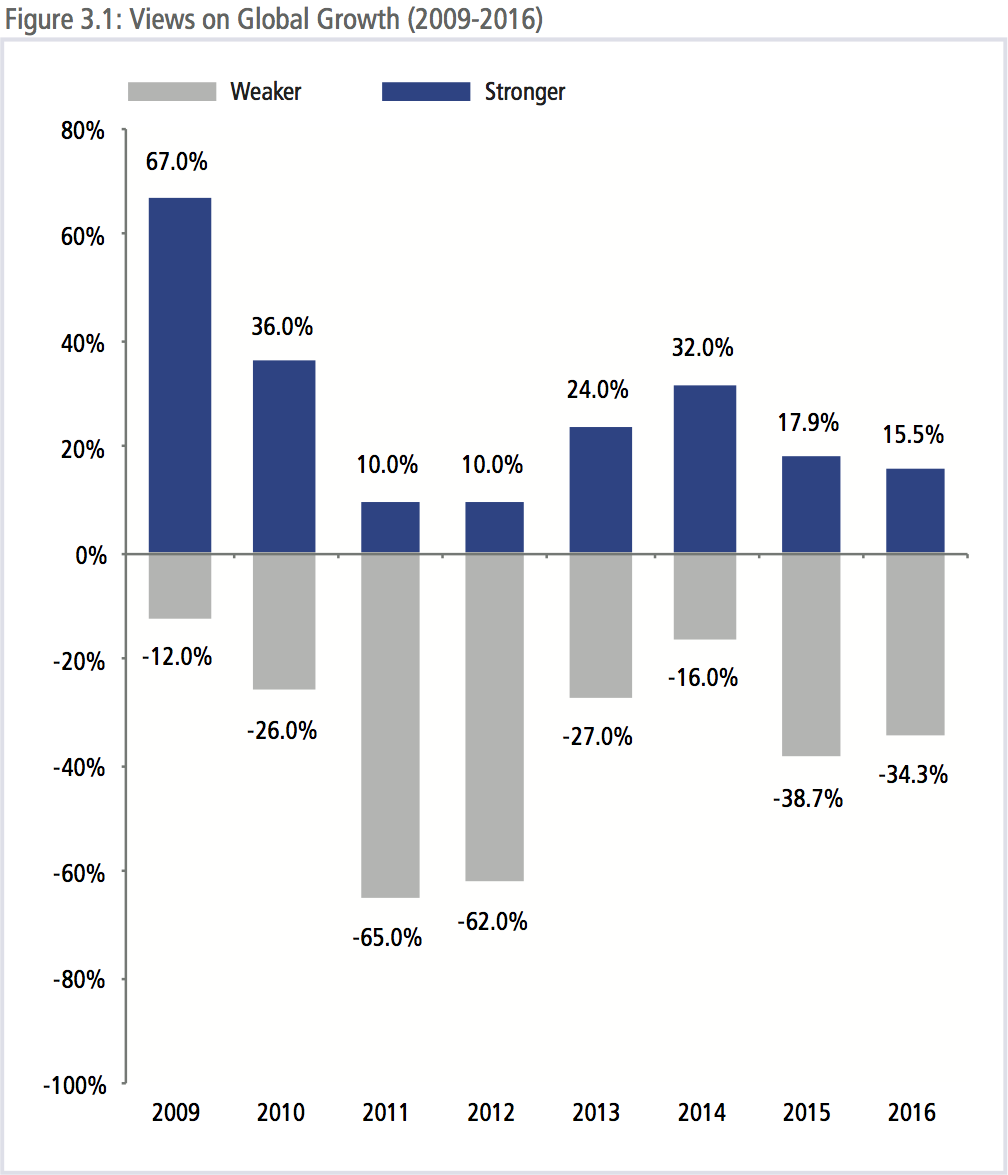
OUTLOOK FOR WORLD ECONOMY REMAINS NEGATIVE
As shown in Figure 3.1, regional perceptions on the global economic outlook remain negative. Thirty-four percent of respondents expect the world economic growth to be weaker over the coming 12 months compared to the last year. These figures are broadly the same as 2015 survey’s results indicating that very little has changed in the minds of the regional policy community.
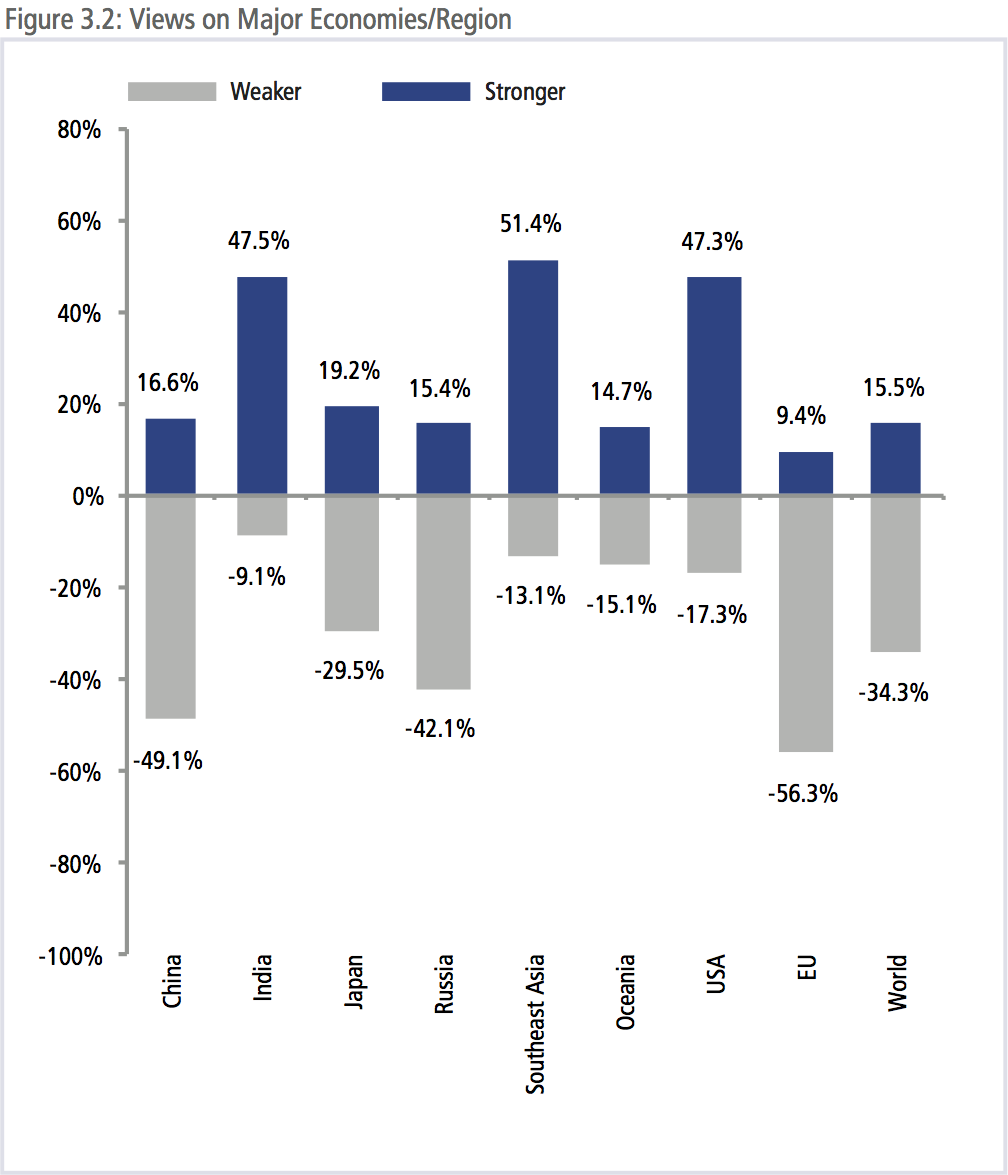
There are some bright spots with respondents most positive about the trajectory of growth in in India followed by Southeast Asia and the United States.
SLOWDOWN IN WORLD TRADE GROWTH NOW A MAJOR RISK
The top 5 risks to growth in the region were:
- A slowdown in the Chinese economy
- Continued slowdown in world trade growth
- Failure to implement structural reforms
- Lack of political leadership
- A slowdown in the US economy
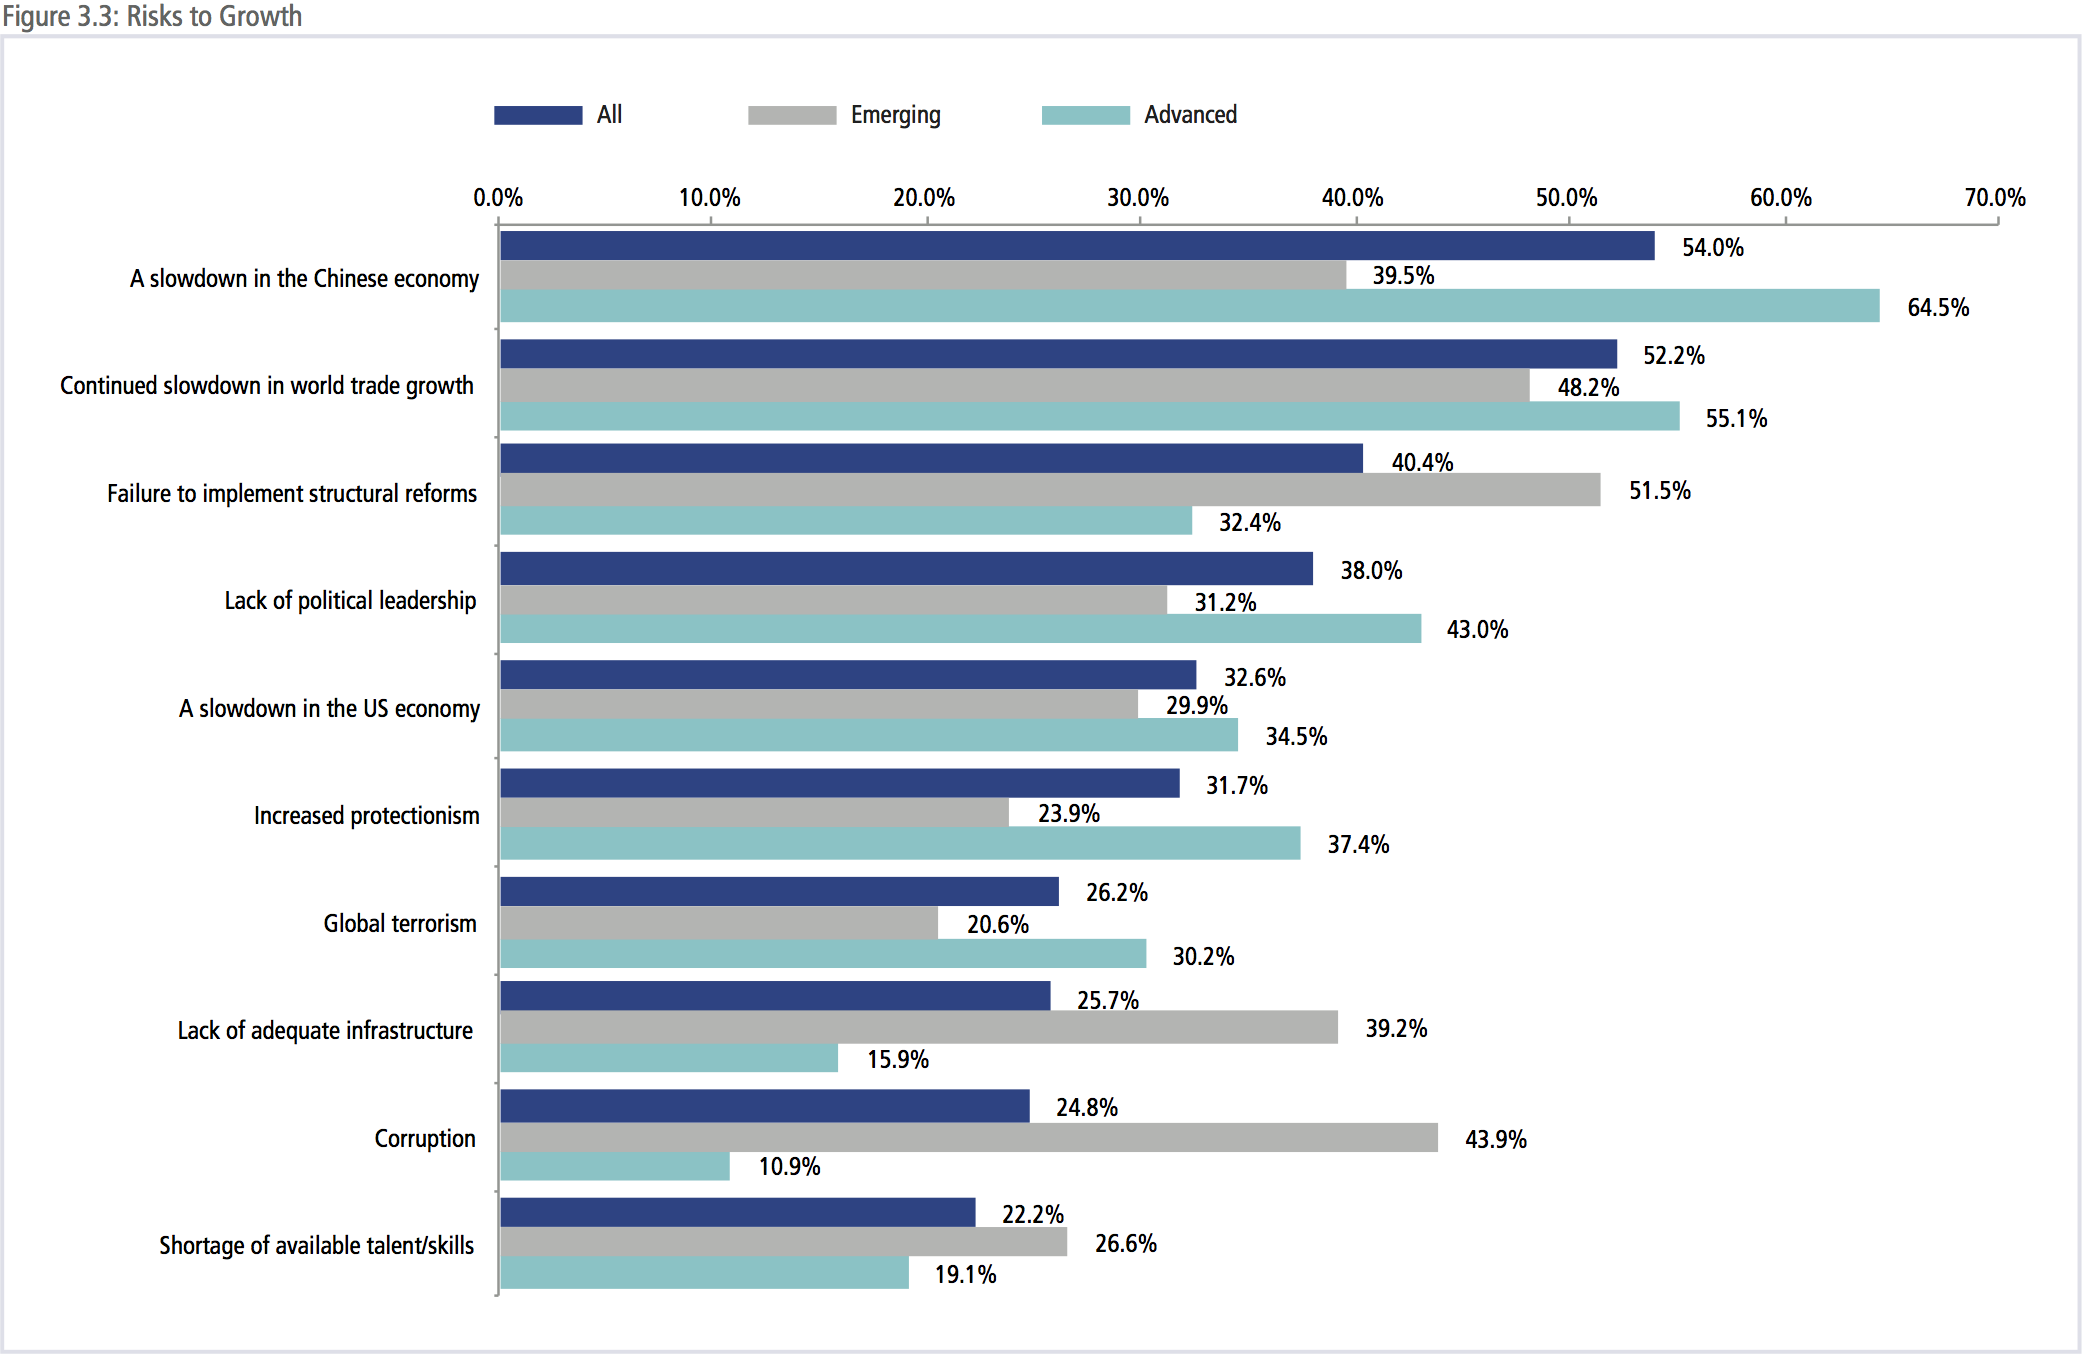
As shown in Figure 3.3, while there was broad convergence among regional economies on their perceptions of risk to growth there were some important differences. Respondents from advanced economies tended to be more concerned than those from emerging economies on the impact of China’s slowdown on their economy. Conversely, the failure to implement structural reforms was seen as a much bigger risk to growth by respondents from emerging economies than those from advanced economies.
With the exception of concerns over the slowdown in world trade growth, the list of top risks is the same as it was in last year’s survey. The managed slowdown in China continues to top respondents concerns as it did last year with the failure to implement structural reform and the lack of political leadership completing the list of the top risks.
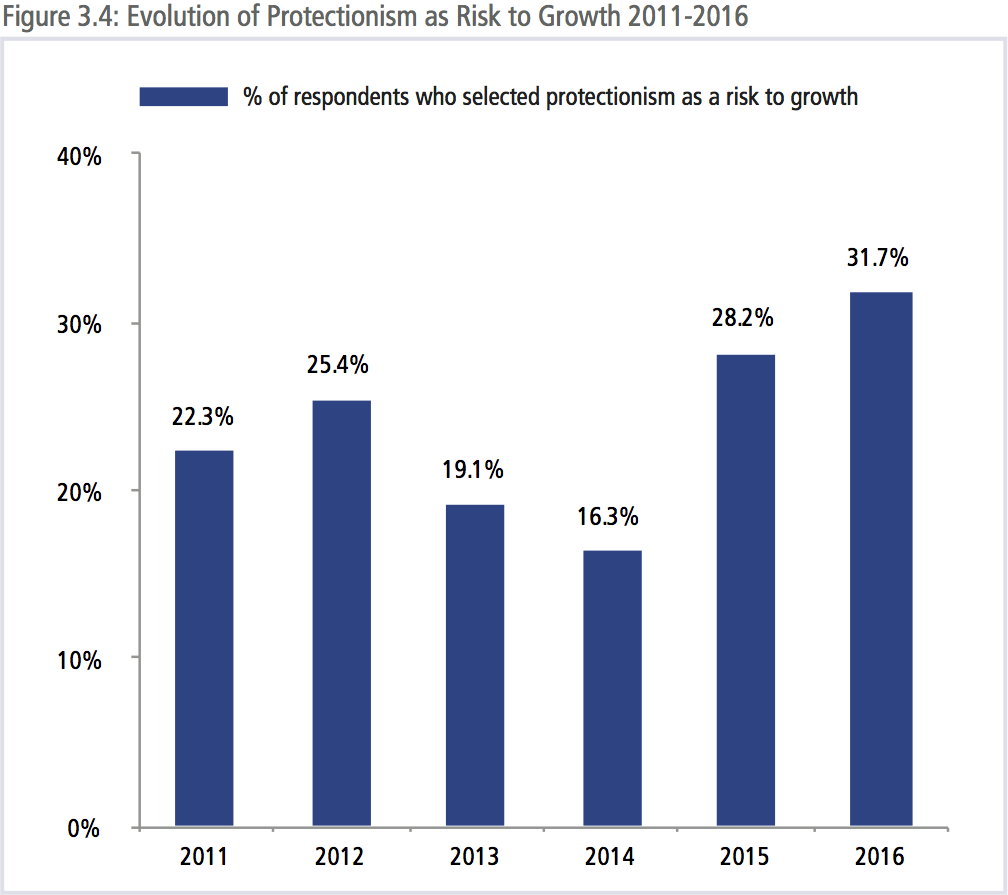
RISING RISK OF PROTECTIONISM
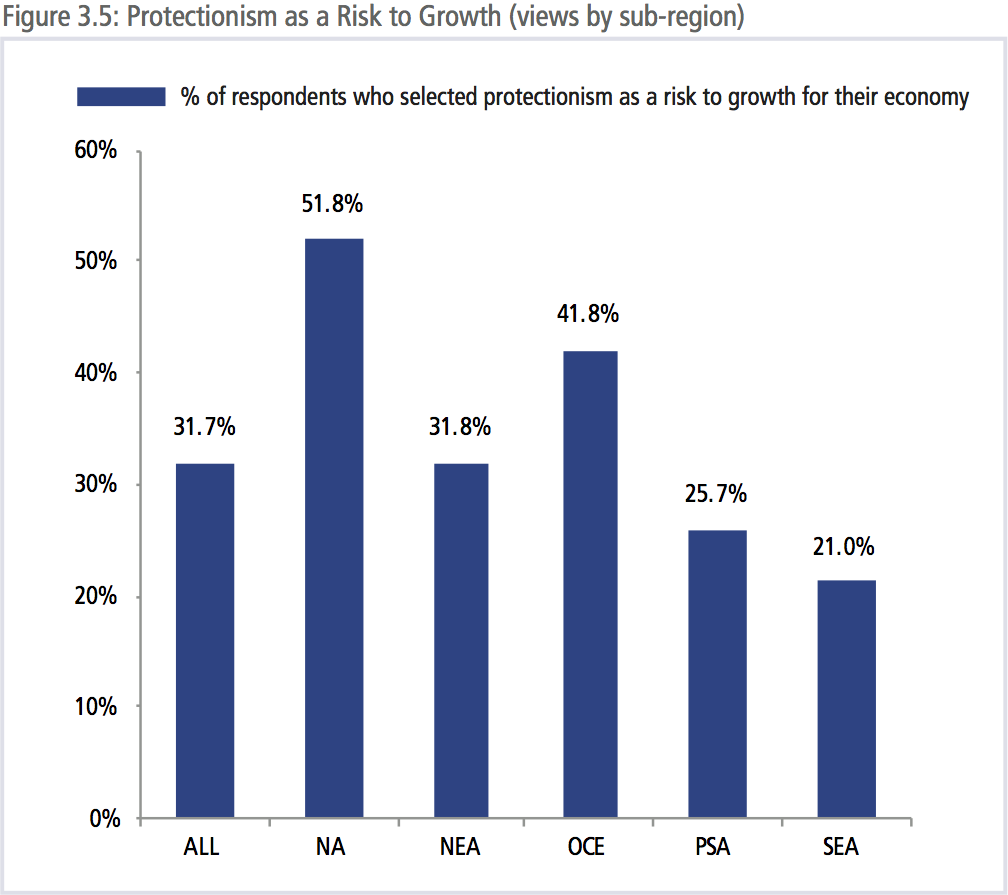
Concerns over the impact of protectionism on economic growth are rising. As shown in Figure 3.4, over recent years, a growing percentage of respondents have been selecting protectionism as a top 5 risk to growth for their economy reaching 32 percent this year. Looking more closely at the breakdown of responses at the sub-regional level in Figure 3.5 it was North Americans who were most concerned about the risk that increased protectionism poses to their economies with 52 percent selecting it as a top 5 risk to growth. The concerns over the lack of political leadership may well be related to the failure to implement structural reforms and increased protectionism.
 ATTITUDES TOWARDS TRADE
Given the assessment of the risk that slower trade growth and protectionism have on economic growth, there are rising concerns over the future of some of the region’s trade initiatives. Those concerns tend to focus on the political support for trade initiatives rather than the net economic gains that they might potentially bring.
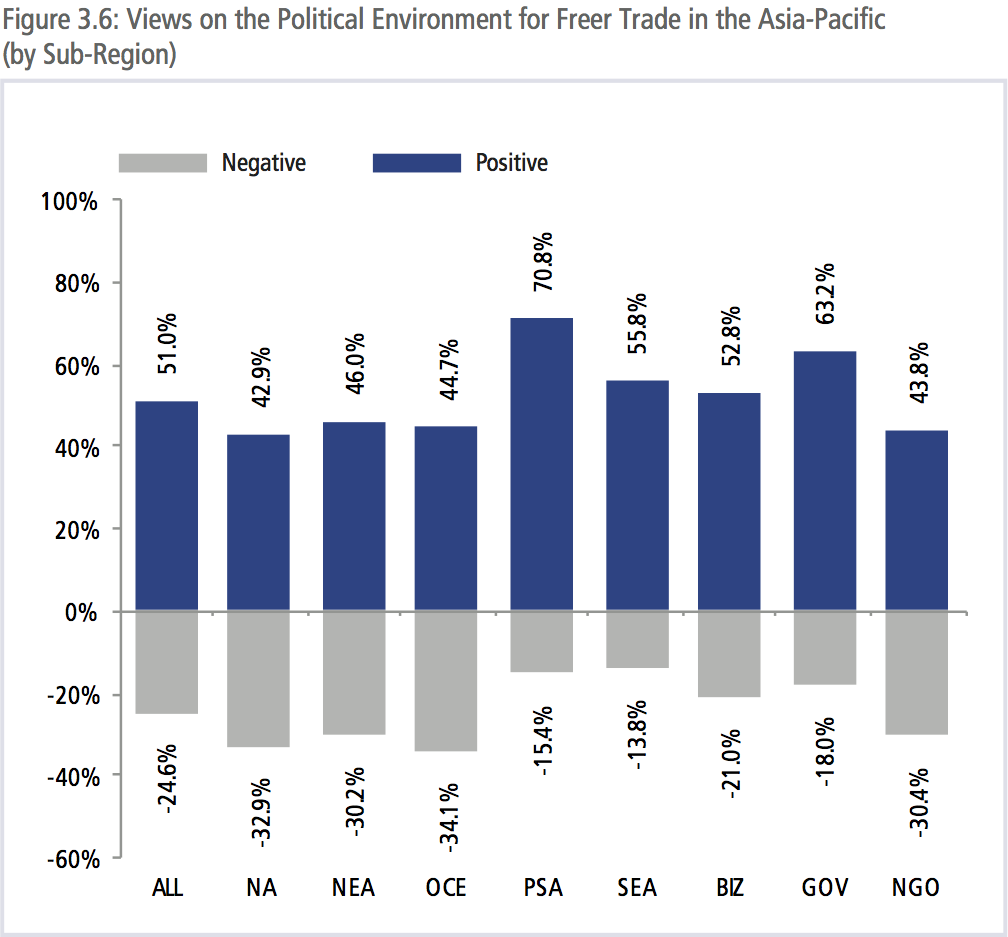
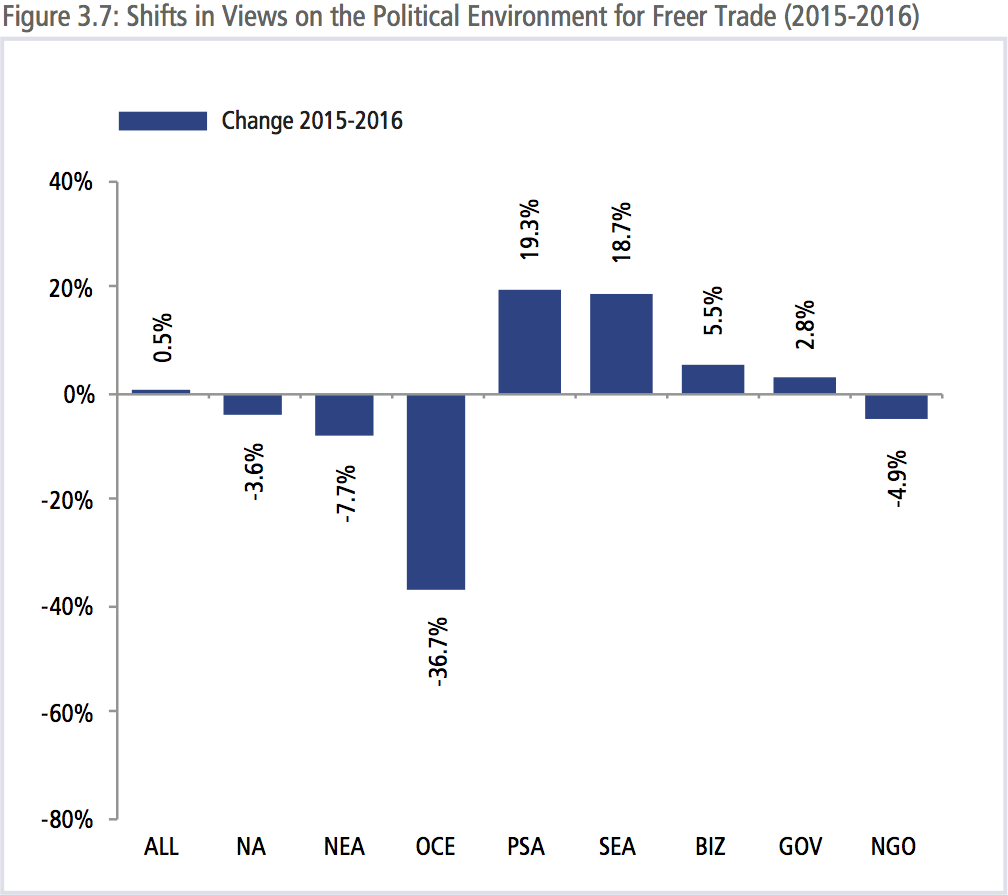
As shown in Figure 3.6, 51 percent of respondents had a positive view on the political environment for freer trade in the region while 25 percent had a negative view or a net favorability of 26 percent. This is very similar to the views expressed to the same question last year. On balance, respondents from North America were the most pessimistic with 43 percent having positive views and 33 percent negative, this was closely followed by Oceania with 45 percent having positive views and 34 percent negative views. Figure 3.7 shows the shift in ‘net favorability’ (those who have a positive view minus those who have a negative view) towards freer trade in the region. The biggest shifts in views between 2015 and 2016 were in Oceania.
By far the most optimistic were respondents from Pacific South America, 71 percent were positive and only 15 percent negative. There were also positive shifts in the region towards trade, with Southeast Asians becoming more positive in their views towards the political environment for trade.
Overall, the assessment from the Asia-Pacific policy community on the political environment for freer trade is skeptical. An overall favorability rating of 26 percent, while still positive, would give pause to any decision-maker on the ability to move forward on an ambitious agenda. Much more needs to be done to make the case for freer trade if any of the ongoing and putative initiatives are going to succeed. It should be emphasized that this is a survey of the policy community and not the general public and that respondents were not asked for their personal views but an assessment of the political environment.
The bottom line is that the policy community in the region’s emerging economies have a much more optimistic assessment of the political environment for freer trade than those in the region’s advanced economies.
WHAT LIES BEHIND FALTERING SUPPORT FOR TRADE?
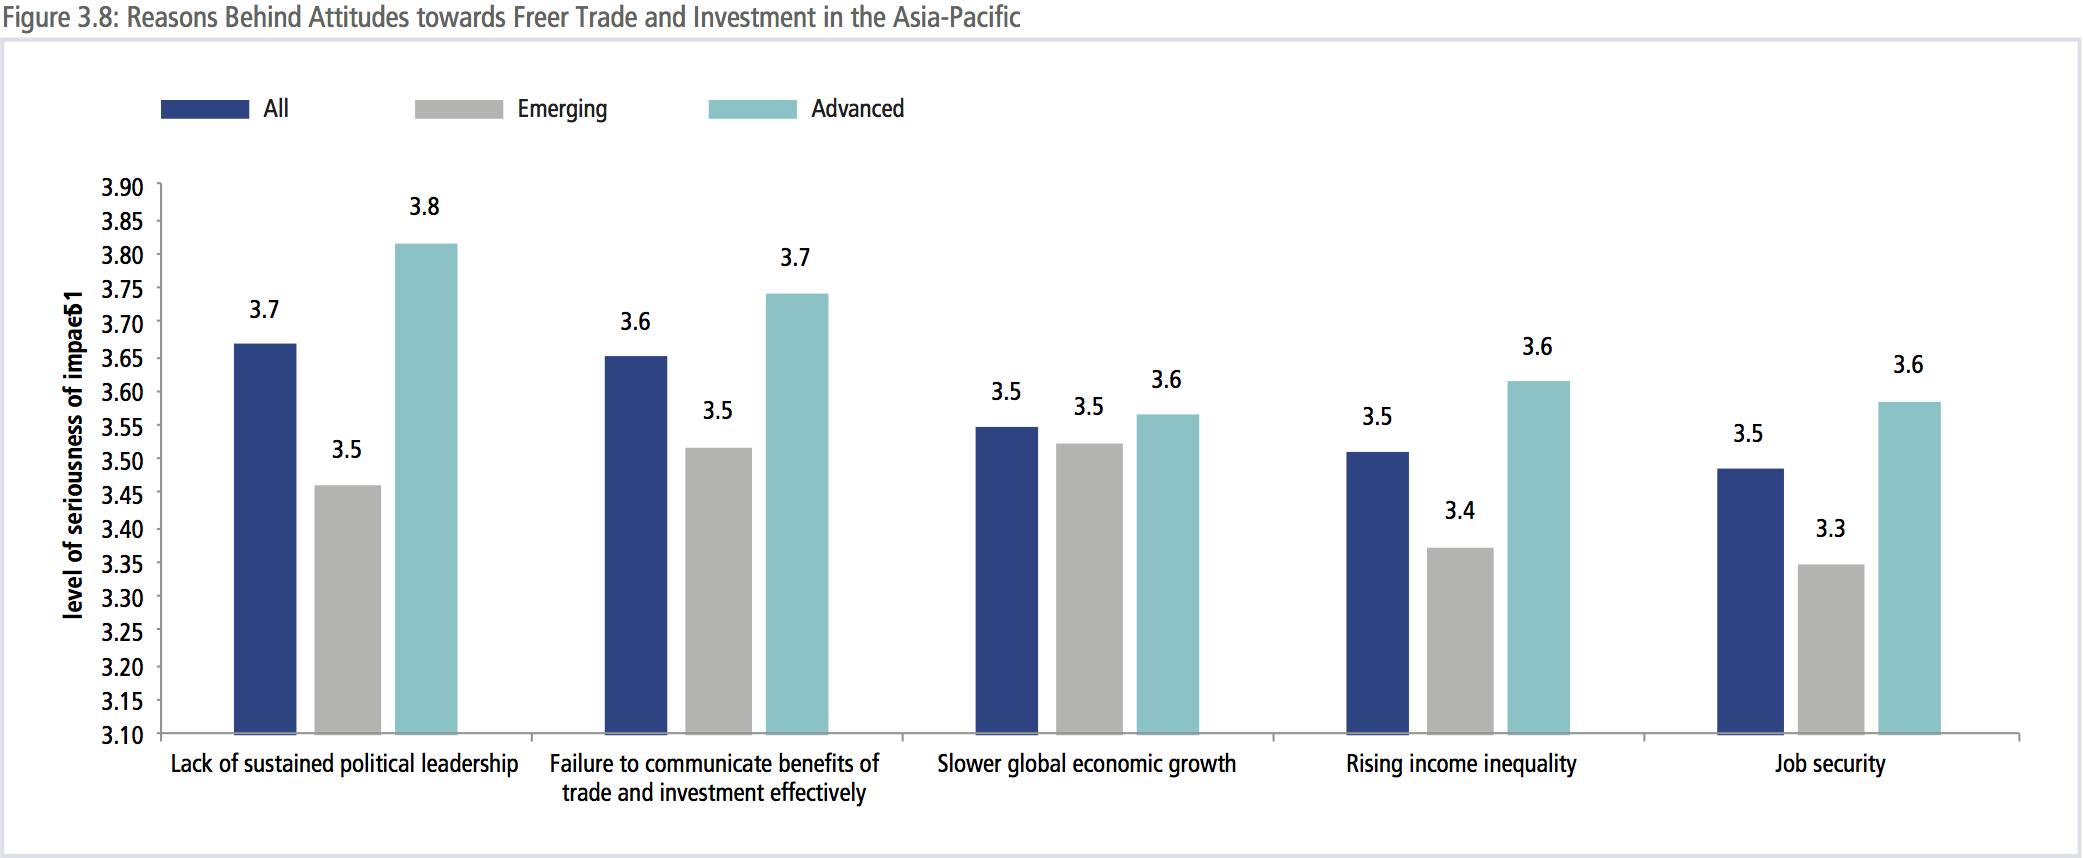
If the region is to make progress on its overarching goal of regional economic integration a better understanding of what lies behind the assessment on the political environment is needed. As shown in Figure 3.8, the top factors that were singled out as having the greatest impact on attitudes towards freer trade:
- the failure to communicate the benefits of trade and investment effectively; and
- the lack of sustained political leadership
Respondents were asked to rate the impact of 5 issues on the impact they have on attitudes towards freer trade and investment in the region. The issue that scored the highest was the lack of sustained political leadership which scored 3.7 with 64 percent of respondents saying that it had a serious or very serious impact. This was closely followed by the failure to communicate the benefits of trade and investment effectively which scored 3.6 with 64 percent of respondents saying it had a serious or very serious impact. Respondents from advanced economies tended to place a much higher degree of importance to all of the factors provided. While discussions on trade, integration and globalization have focused on their impact on income inequality and jobs, the regional policy community tended to look to the failure to communicate the benefits of trade and sustained political leadership as having the most serious impact.
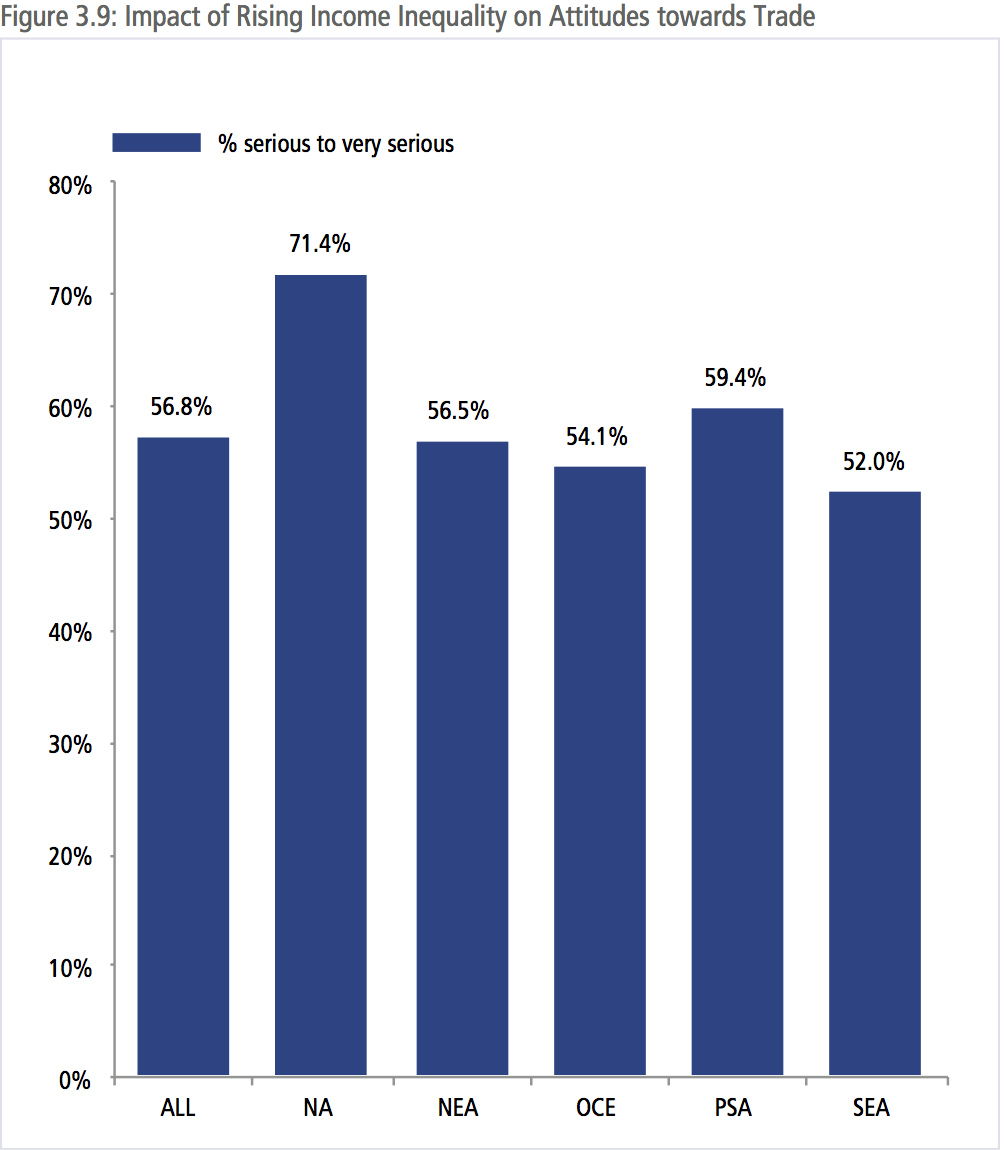
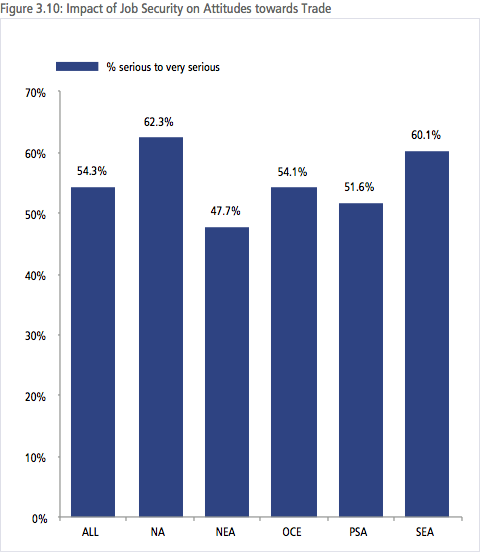
As shown in Figures 3.9 and 3.10, North American respondents thought that rising income inequality had a more serious impact on attitudes towards trade than others at 71 percent compared to 52 percent for Southeast Asians. A similar pattern was seen with respect to job security with 62 percent of North Americans saying that it had a serious to very serious impact compared to 48 percent of Northeast Asians.
The ranking of issues was fairly consistent across sub-regions even though the severity of the impact differed, except for Northeast Asians. For Northeast Asia, it was slower economic growth that had the most serious impact on attitudes towards trade. Regional governments need to do much more to convince skeptical publics, especially in advanced economies of the benefits of trade.
VIEWS ON THE BENEFITS OF ECONOMICINTEGRATION INITIATIVES
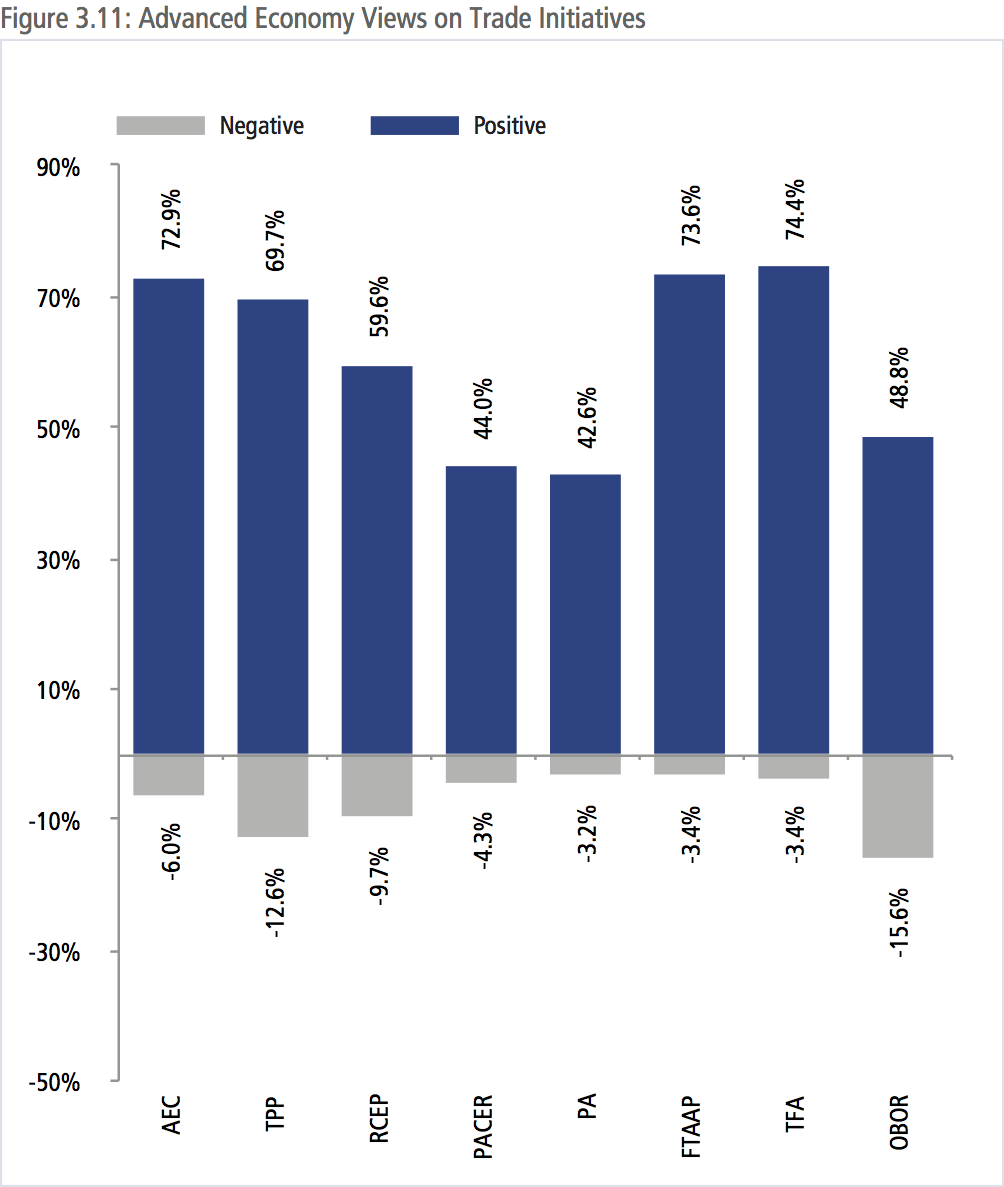
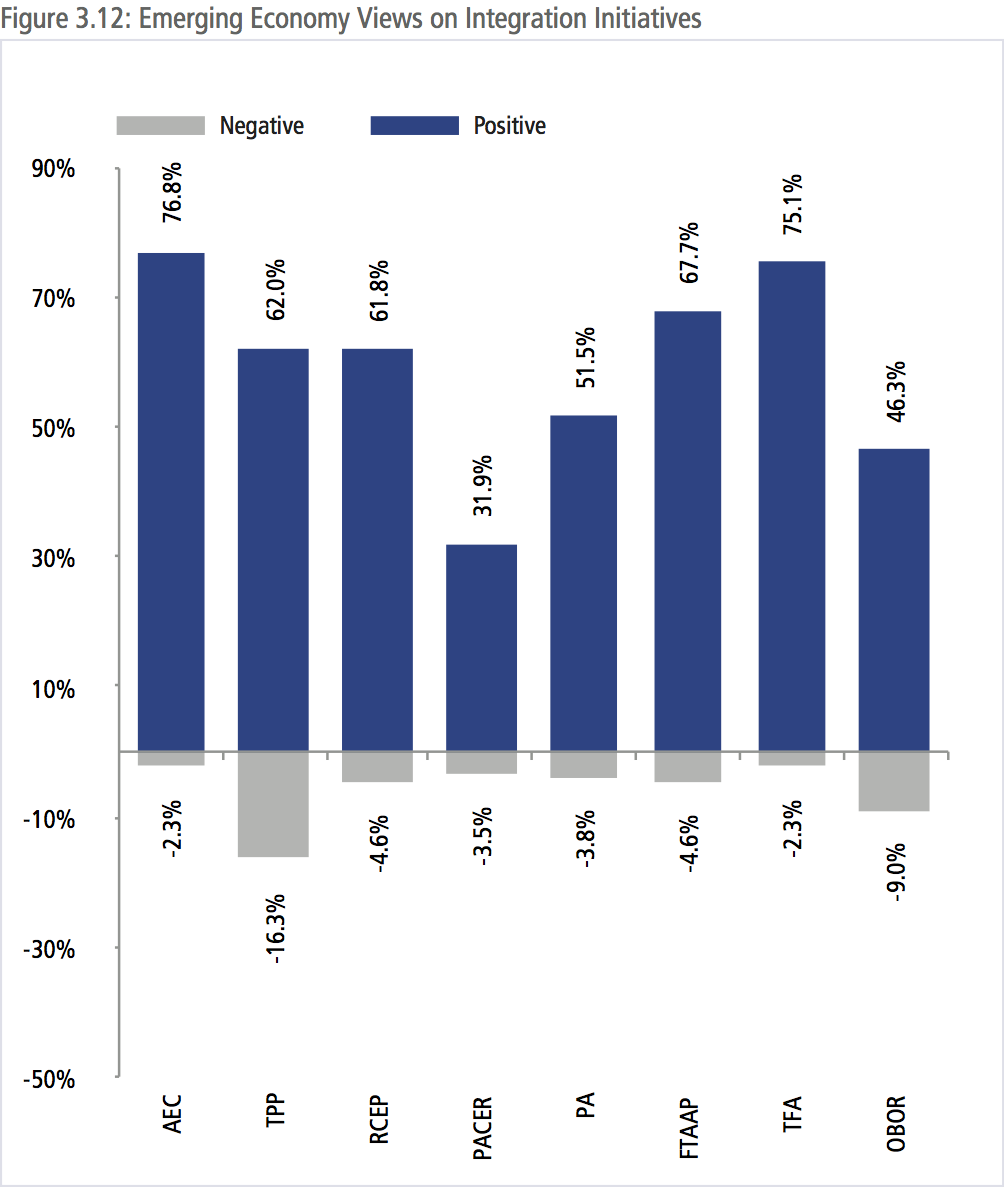
In spite of the less-than-enthusiastic view of the political environment for free trade, assessment of the economic benefits of a large range of economic integration initiatives was overwhelmingly positive. Overall respondents were most positive about the impact of the WTO’s Trade Facilitation Agreement (TFA) on their economies. That such assessment of the TFA was shared by respondents from both emerging and advanced economies, it should help to give impetus to further multilateral efforts.
As shown in Figure 3.11 and 3.12, there was very little difference between respondents from advanced and emerging economies on how these initiatives would impact their economies. The two pathways to the Free Trade Area of the Asia-Pacific (FTAAP), the Trans-Pacific Partnership and the Regional Comprehensive Economic Partnership were seen by over 60 percent of respondents as having a positive impact on regional economies.
The positive view of regional initiatives was regardless of whether the respondent’s economy was part of the grouping. For example, 67 percent of North Americans thought that the ASEAN Economic Community would have a positive impact on their economy as did 52 percent of respondents from Pacific South America.
Respondents tended to be less enthusiastic about less well known sub-regional initiatives such as the Pacific Agreement on Closer Economic Relations (PACER) which is an agreement among members of the Pacific Islands Forum plus Australia and New Zealand, and the Pacific Alliance, which is an agreement among Chile, Colombia, Mexico and Peru. However, these results were strongly influenced by the lack of awareness about them, with 25 percent of respondents selecting ‘don’t know’ on the impact that they would have on their economies. The One Belt One Road Initiative (OBOR) received a somewhat lukewarm assessment compared to the TPP and RCEP, and as with PACER and the PA there is was a large lack of awareness with 19 percent selecting ‘don’t know’ for OBOR.
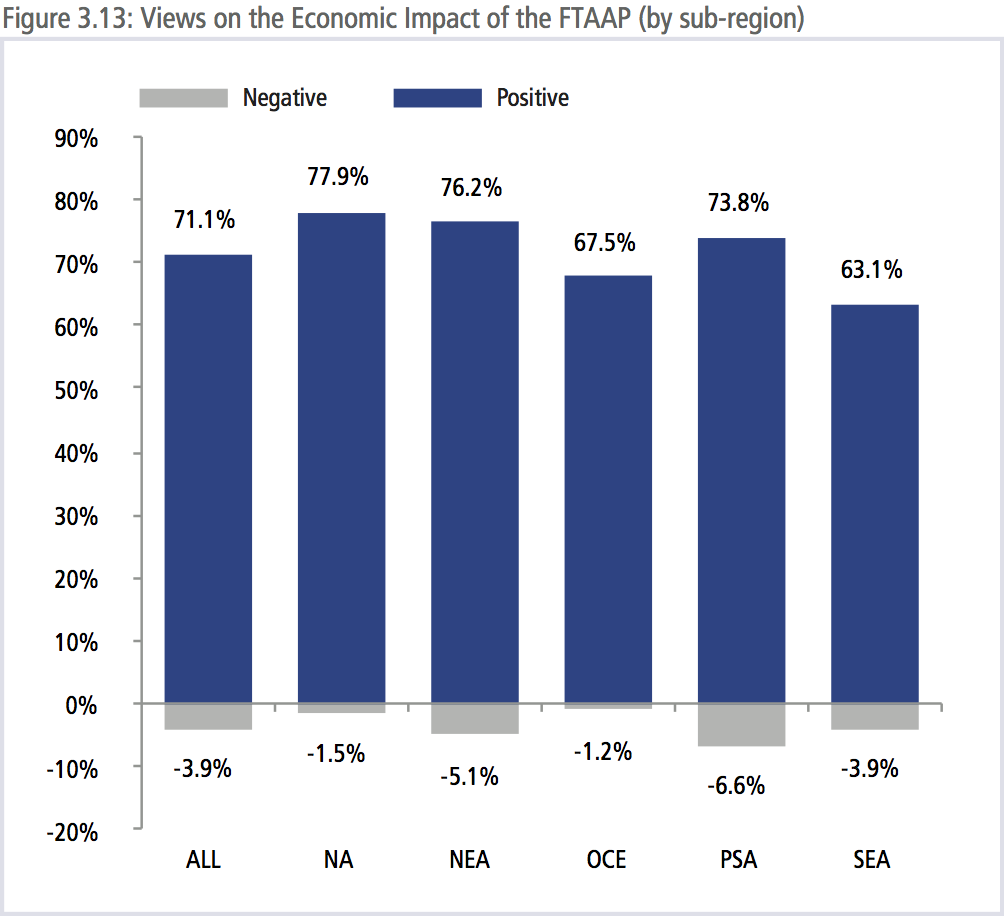
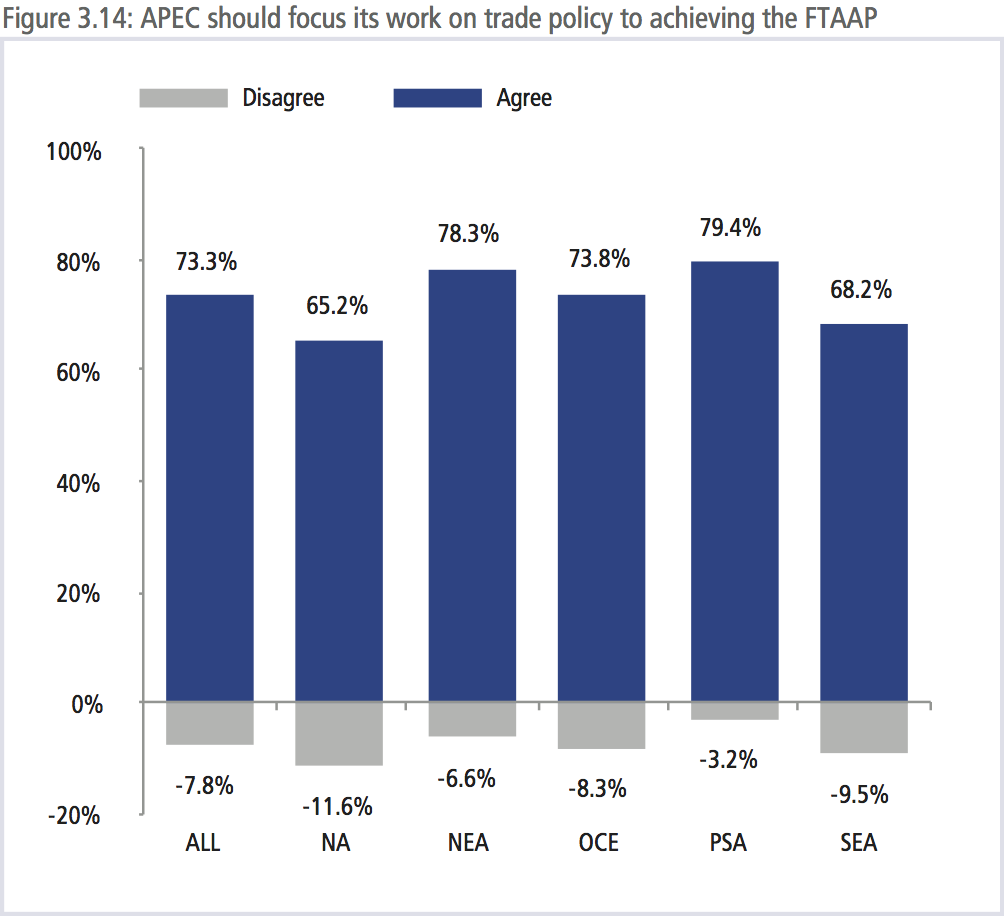
APEC SHOULD FOCUS TRADE WORK ON ACHIEVING THE FTAAP
The idea of the FTAAP has been discussed by APEC for over a decade. Significant progress was made in 2014 with the adoption of ‘The Beijing Roadmap for APEC’s Contribution to the Realization of the FTAAP.’ There was broad agreement that the economic benefits of the FTAAP were positive with 71 percent saying it would have a positive impact on their economy compared to just 4 percent who thought it would have a negative impact. There was also broad agreement that APEC should focus its work on trade policy to achieving the FTAAP . This does not necessarily mean that APEC would be the negotiating forum for an agreement, indeed the Beijing Roadmap is explicit in that “the FTAAP will be realized outside of APEC, parallel with the APEC process.” However, the view seems to be that APEC should at the very least continue its incubator role if progress is to be made.
DRIVERS OF GROWTH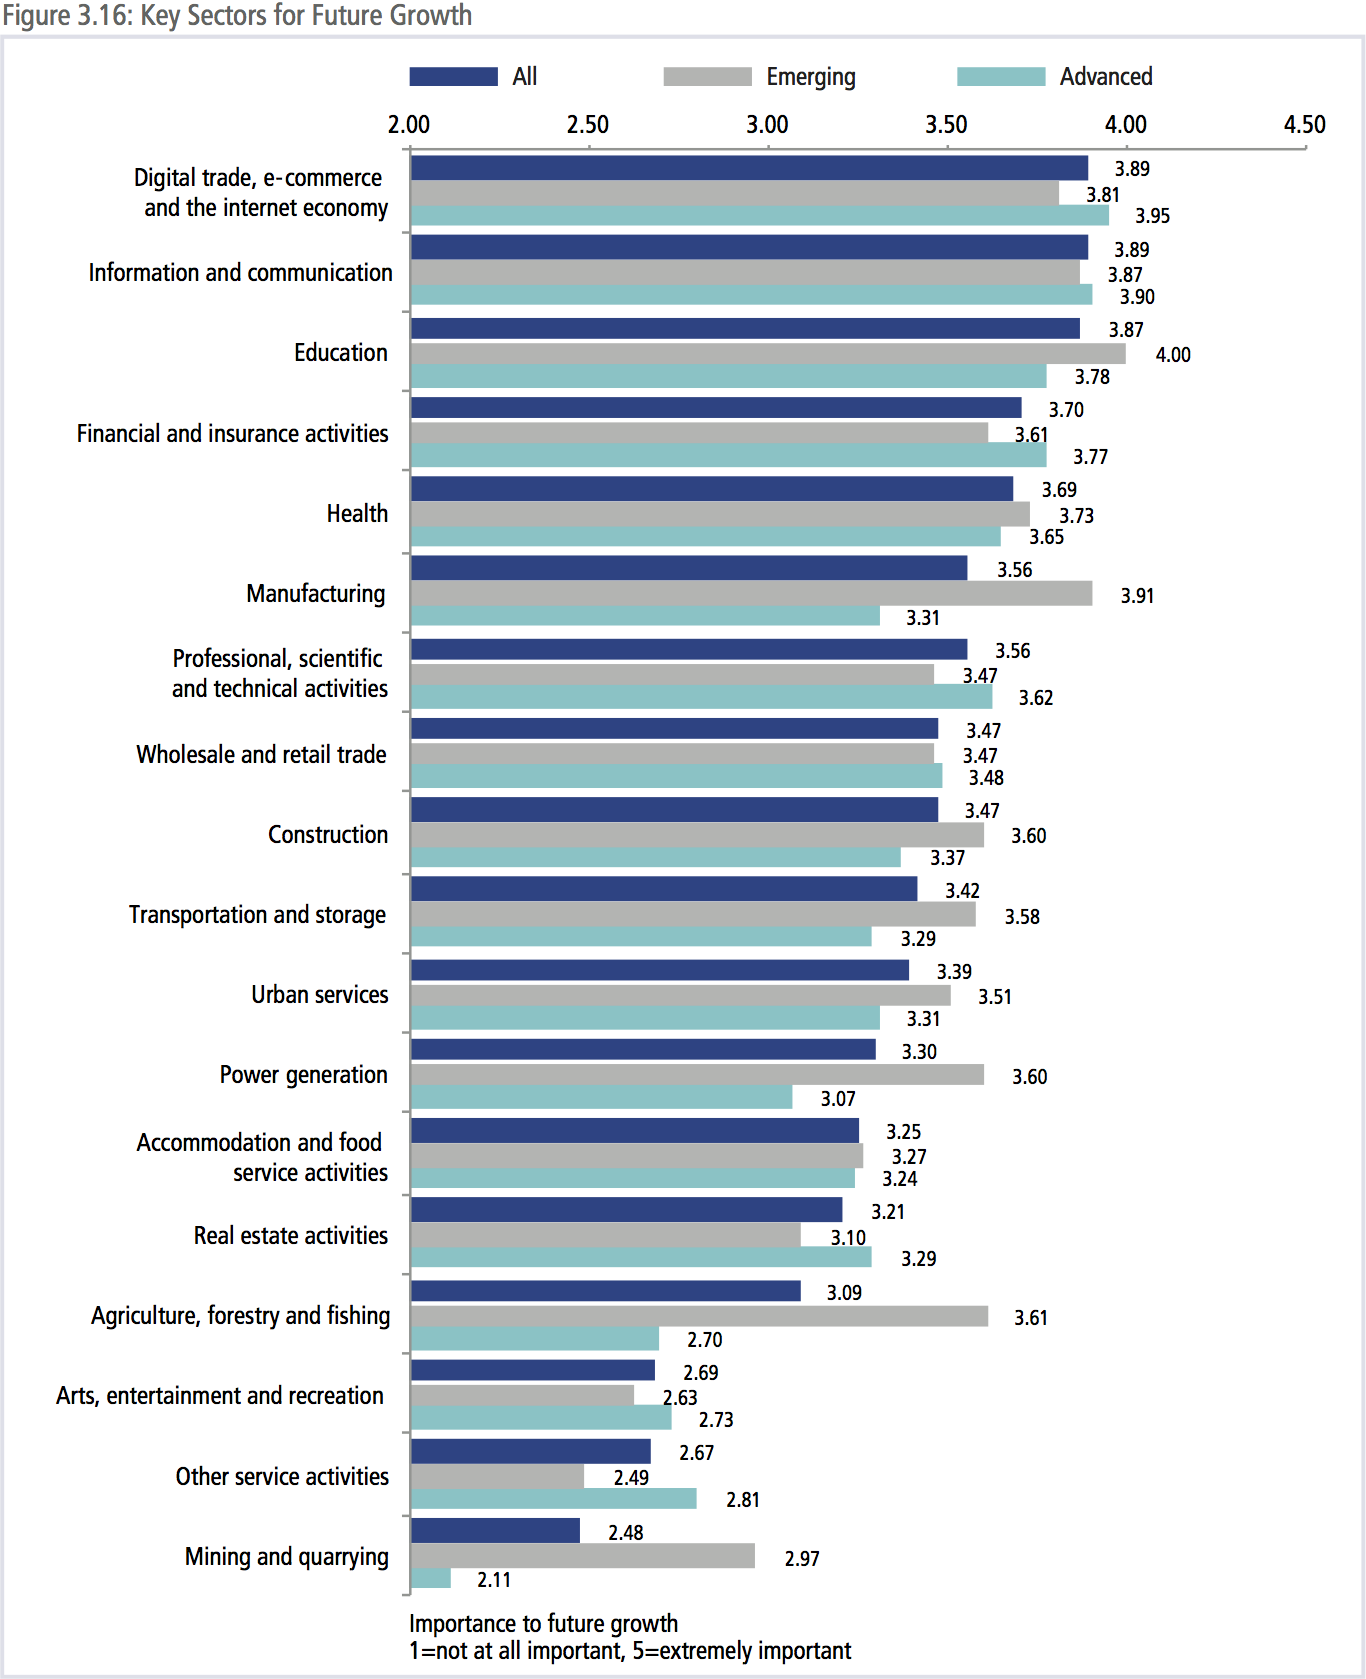
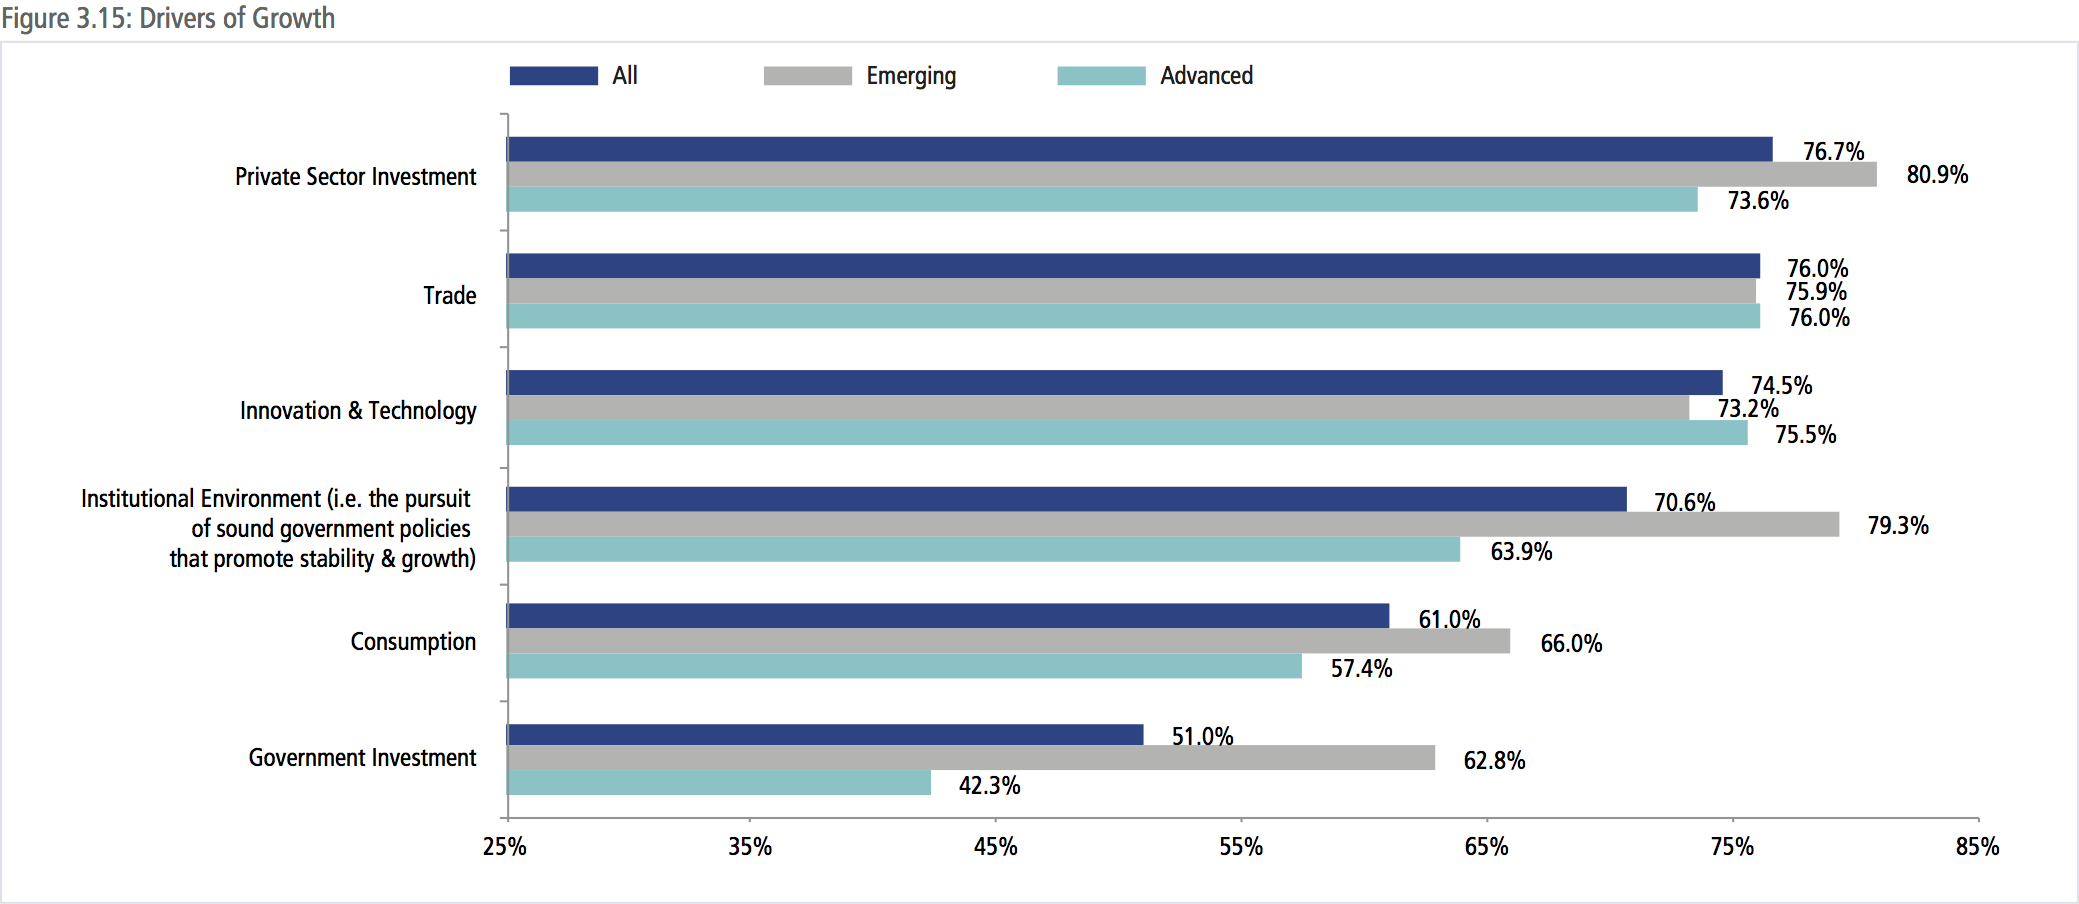
As discussed in Chapter 1, the role of trade as a driver for Asia-Pacific growth has been diminishing since the Global Financial Crisis. While the factors behind this are both cyclical and structural, new drivers of growth need to be developed. As shown in Figure 3.15, respondents thoughts that private sector investment would be the most important driver of growth for economies in the Asia-Pacific region.
However, there were some significant differences among respondents from advanced and emerging economies. The greater focus on structural reforms and the policy environment for emerging economies, as seen in their assessments of risks to growth, was also evident in their perceptions of key drivers of growth. Some 80 percent of respondents from emerging economies rated the institutional environment as very to extremely important to the growth of their economies over the next five years compared to 64 percent of respondents from advanced economies.
Even though the assessment of the political environment for trade was less than enthusiastic, trade was still seen as an important driver of growth over the next 5 years. This sentiment was equally shared by respondents from both advanced and emerging economies.
SERVICES SECTOR TO DRIVE GROWTH
Looking more deeply at potential sectors for growth, as shown in Figure 3.16, there is a clear view that the future of growth in the region is in the services sector. The top five sectors for the future growth of the region were: information and communication; education; digital trade, e-commerce and the internet economy; finance and health – all services.
There were, however, some large differences between perceptions from emerging and advanced economy respondents, with the former placing a much higher level of importance on the role of agriculture and manufacturing in their economic growth, while the latter tend to place a much higher degree of importance on services sub-sectors. As discussed in more detail in Chapter 1, while manufacturing has contributed around 30 percent to emerging economy growth between 2010 and 2014, services contributed around 53 percent and agriculture less than 5 percent. While the structure of emerging economies has changed considerably, perceptions lag behind which tend to place a greater level of importance on the role of agriculture as a driver of growth.
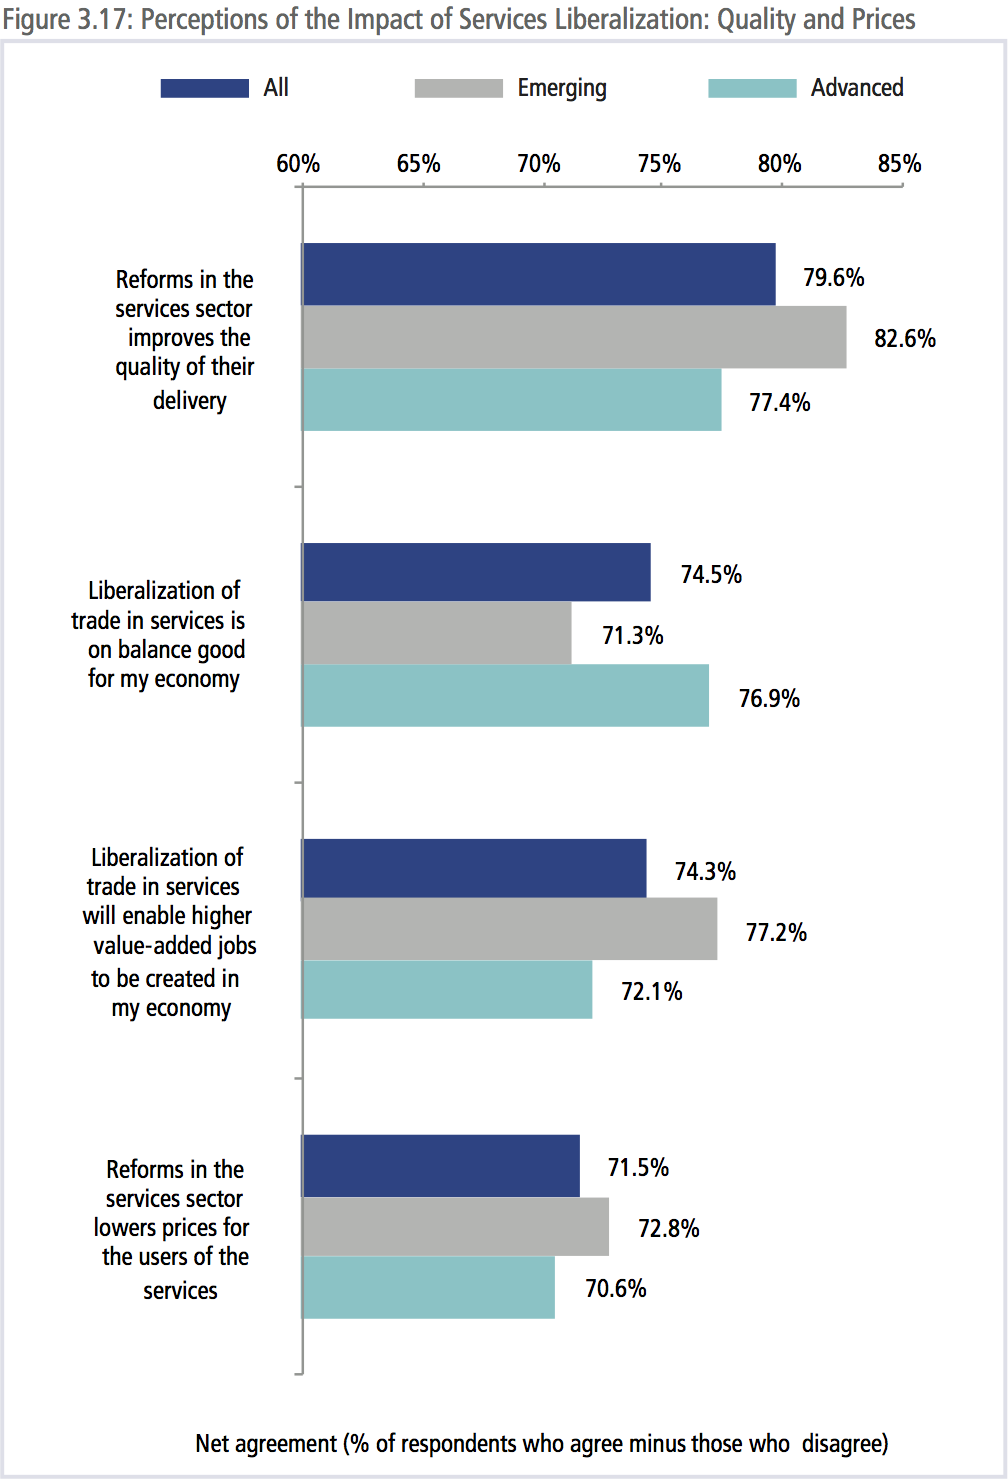
PERCEPTIONS OF THE IMPACT OF SERVICES LIBERALIZATION
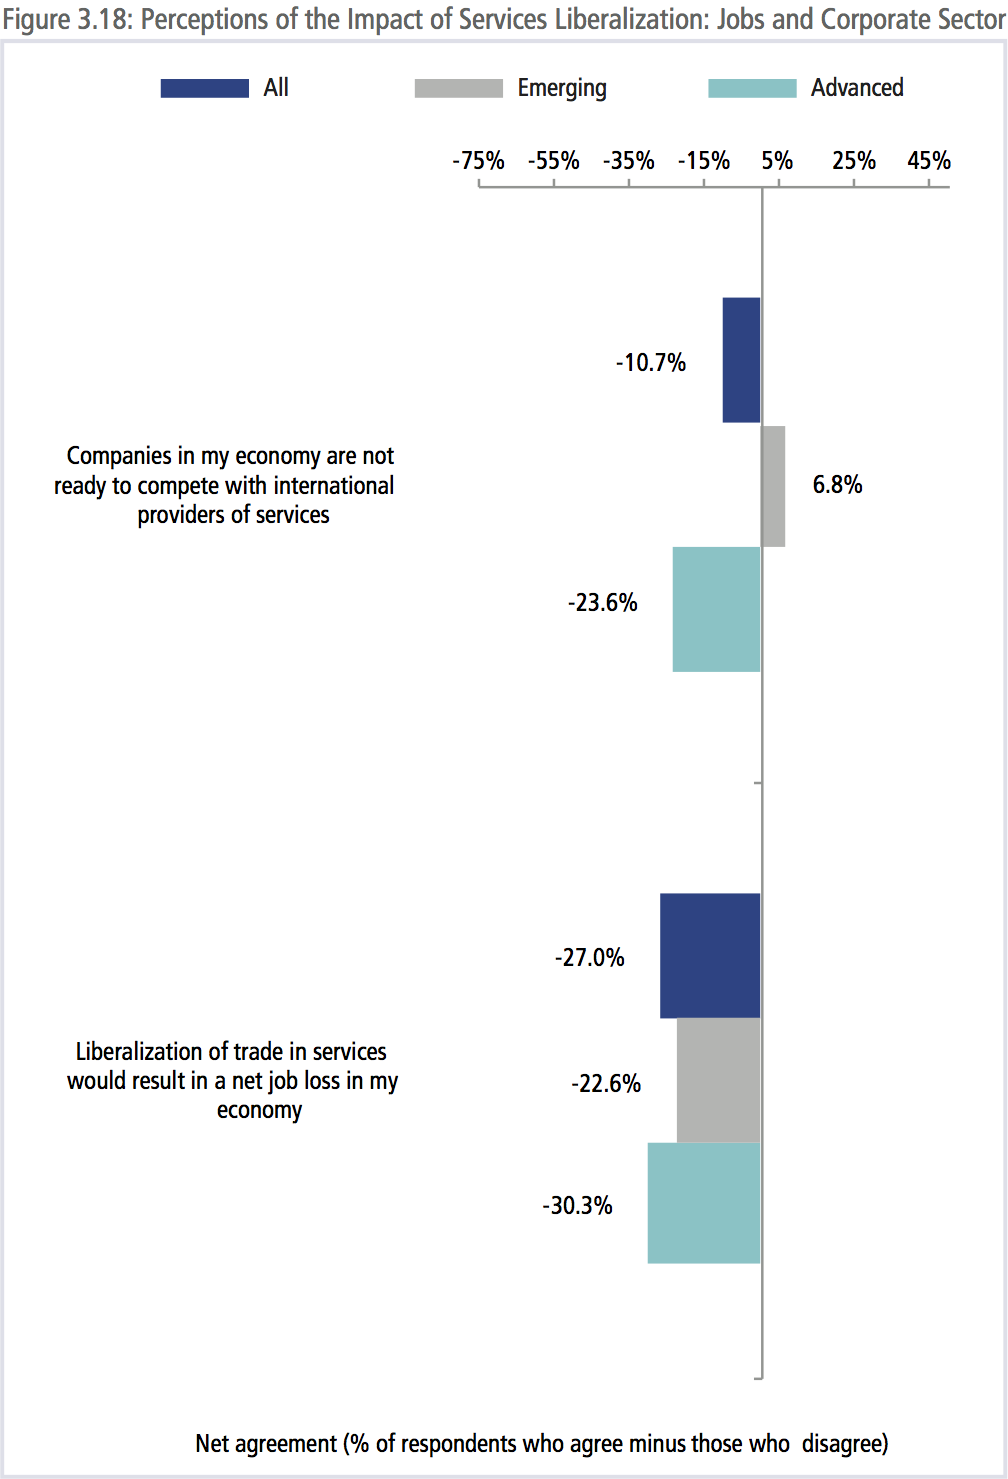
As shown in Figure 3.17, there was a broad convergence of views that the liberalization of services trade was beneficial to the economy in terms of improving the quality of overall services delivery, the creation of better jobs and lower prices. As shown in Figure 3.18, there was also broad disagreement across the region that the liberalization of trade in services would result in a net job loss.
However, one issue on which there was a divergence in views was whether or not domestic services providers were ready to compete with international providers of services. Respondents from advanced economies thought that their companies were ready for international competition while those from emerging economies did not. While this point is perhaps intuitively obvious, it highlights the critical political economy of services liberalization and trade liberalization generally. While trade may be beneficial for the economy in terms of higher overall welfare and job creation, there is a view that some companies are not ready for competition which may stall the liberalization process costing the overall economy.
BARRIERS TO SERVICES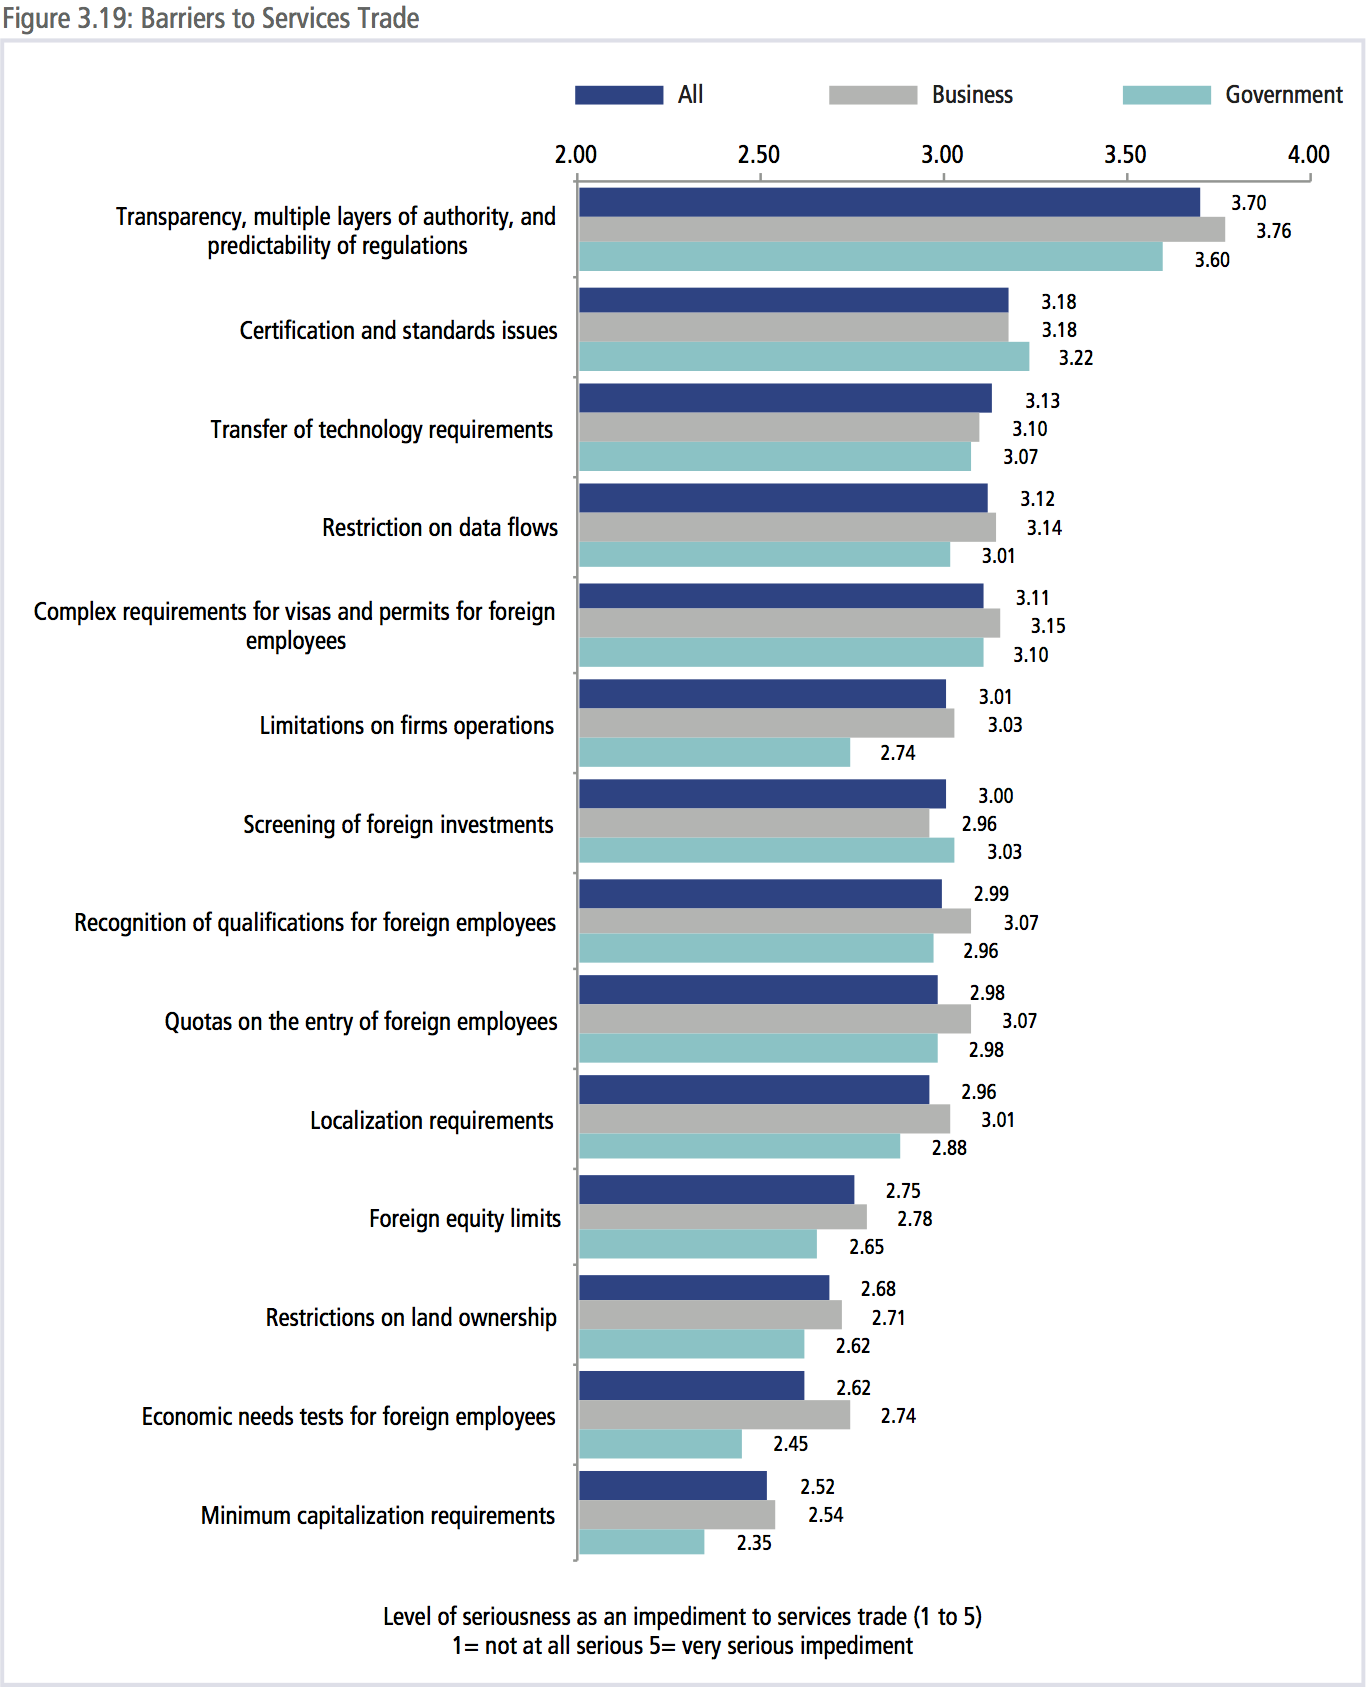
While there is a general expectation that the services sector will drive future growth and that the liberalization of services is overall beneficial to the economy, the challenge is how to identify the most serious barriers to services. Barriers differ from economy to economy and sector to sector. There was however broad agreement that the most serious barrier to trade in services is transparency (or the lack thereof), multiple layers of authority and the lack of predictability. While respondents from both the business sector and the government thought that this was the biggest problem. As shown in Figure 3.19, on a scale of 1 to 5 with 1 being a not at all serious and 5 a very serious impediment, business respondents were more concerned than government officials. In percentage terms, 63 percent of business respondents considered the lack of transparency as a serious to very serious impediment to services trade compared to 54 percent of government respondents. Indeed, this finding was true across all types of impediments with just two exceptions: certifications and standard and screening of foreign investments. While respondents from government rated certification and standards issues as the second most serious impediment to services trade, businesses ranked it only as the sixth highest.
Businesses saw restrictions on data flows as the fourth highest impediment to services trade, governments saw it as only the sixth highest. The problem of barriers to data flows is a relatively new issue that requires a better understanding of the costs they impose on businesses – especially SMEs. As shown in Figure 3.20, 44 percent 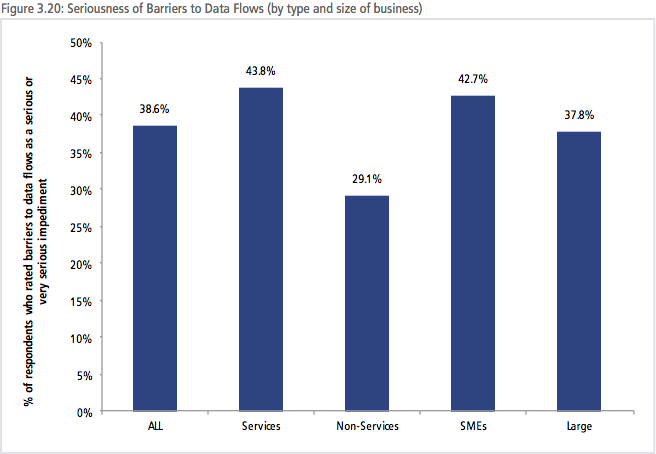 of respondents from services firms considered barriers to data flows a serious to very serious impediment compared to just 29 percent of those from non-services firms.
Given work that is being done to better integrate SMEs into the regional economy, more work needs to be done to understand how barriers to data flows are impacting them. Forty-three percent of SME respondents though that barriers to data flows were a serious to very serious impediment compared to 38 percent of large firms. This indicates that the free flow of data is more important for the region’s SMEs than for large firms and multinational corporations. In addition to assessing the serious of a variety of impediments to services, respondents were also asked to suggest what APEC as a grouping could do to resolve the issue.
TRANSPARENCY, MULTIPLE LAYERS OF AUTHORITY, AND PREDICTABILITY OF REGULATIONS
Over a hundred suggestions were given by respondents, ranging from promoting APEC’s role as an advocacy body to promoting greater transparency and consistency in regulatory practices, undertaking assessments of the impact of regulation through to an agreement to harmonize technical regulations.
CERTIFICATION AND STANDARDS ISSUES
In their suggestions, respondents tended to focus on the usage of existing international standards such as Codex and performancebased standards such as ISO. They also suggested that APEC could come to agreements on common requirements for certification and standards as well on phytosanitary regulations.
TRANSFER OF TECHNOLOGY REQUIREMENTS
There was a wide range of suggestions such as: APEC agreeing to eliminate transfer requirements to cooperation to implement technology transfer that builds capacity and respects protection of intellectual property. There were also suggestions that technology transfer should not be a trade issue but should be defined as a development issue.
RESTRICTIONS ON DATA FLOWS
A number of suggestions were made on what APEC could do to resolve the impact that restrictions on data flows have on services trade. These include:
- Investigate data flows to and from the region
- Limiting restrictions
- Dialogues on best practice
- Surveys of business on the impact that data flow restrictions have on their operations
- Remove all limitations on data flows
COMPLEX REQUIREMENTS FOR VISAS AND PERMITS FOR FOREIGN EMPLOYEES
Suggestions on how to deal with complex requirements for visas and permits for foreign employees ranged from consultation with the business community on the requirements that have the greatest impact on their operations; agreeing on harmonized requirements for visas and permits; to having APEC-wide visas and employment passes for qualified employees.
PERCEPTIONS OF APEC CONTINUE TO IMPROVE
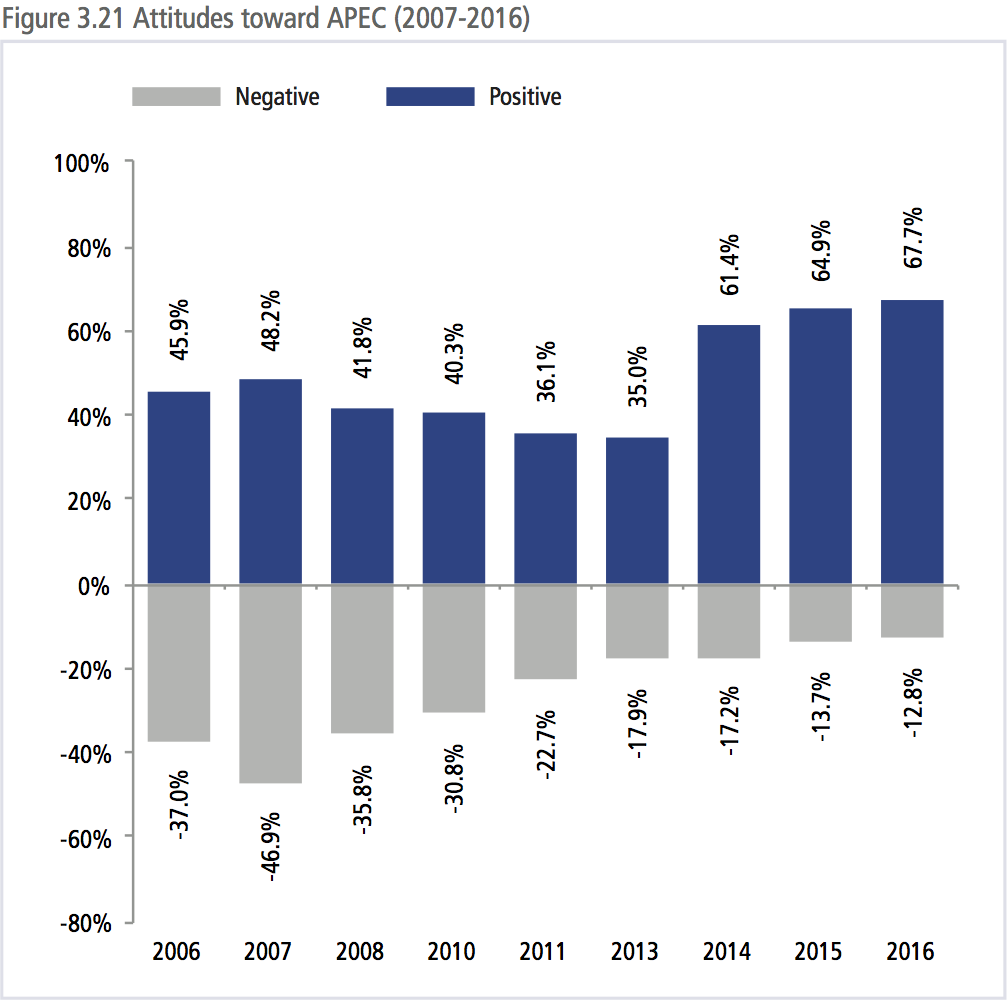
Since PECC started the State of the Region survey, a variety of questions have been asked about attitudes towards APEC. As shown in Figure 3.22, attitudes in 2006 were ambivalent, 46 percent respondents had a positive view of APEC compared to 37 percent who had a negative view. From 2006 to 2013, respondents with a positive view of APEC fell to a low of 35 percent, even though those with a negative view also fell to 18 percent. In 2014, attitudes towards APEC swung around with 61 percent having a positive view and 18 percent negative. The improvement in the perception of APEC has continued since then. This year, 68 percent expressed a positive view about APEC and 13 percent a negative giving APEC its best ‘approval rating’ of 55 percent.
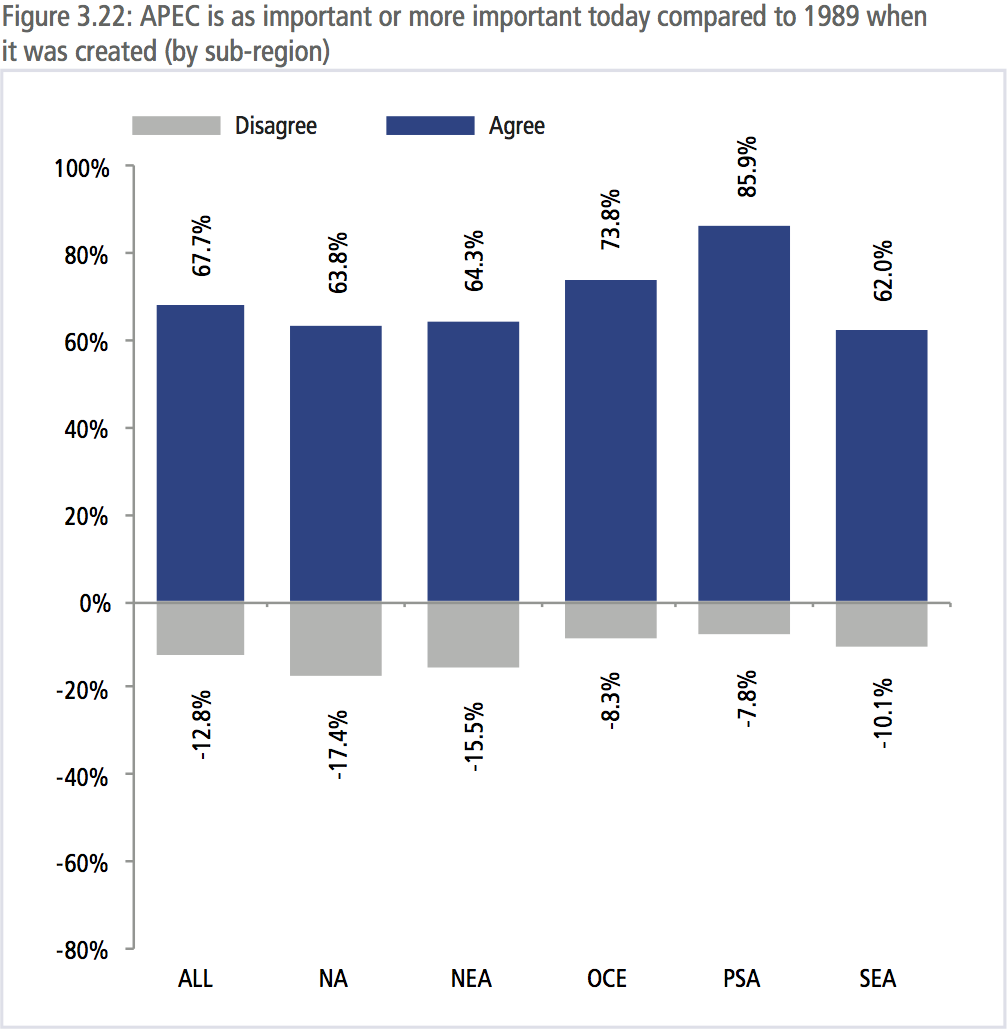
This is a considerable improvement in perception from the last time that Peru hosted APEC back in 2008 when only 42 percent of respondents had a positive view and 36 percent had a negative view. As shown in Figure 3.22, the positive view on APEC is shared across the whole Asia-Pacific but by far the most enthusiastic subregion is Pacific South America with 86 percent of respondents having a positive view and only 8 percent a negative view.
There has been a remarkable turnaround in the views of North American respondents in recent years. In 2007, 63 percent of North American respondents had a negative perception of APEC while only 30 percent had a positive view. The poor perception of APEC in North America continued from 2007 till 2013 when the percentage of respondents with a positive view of APEC began to outweigh those with a negative view.
IS IT TIME FOR APEC TO EXPAND ITS MEMBERSHIP?
One issue confronting APEC is membership. The Asia-Pacific does not have a clear boundary, and as defined by APEC’s membership, stretches from the Baltic Sea in Europe to the Atlantic shores of North America. Several economies have expressed an interest in joining APEC since the 10-year moratorium was imposed in 1997. However, no agreement has been reached on admitting new members.
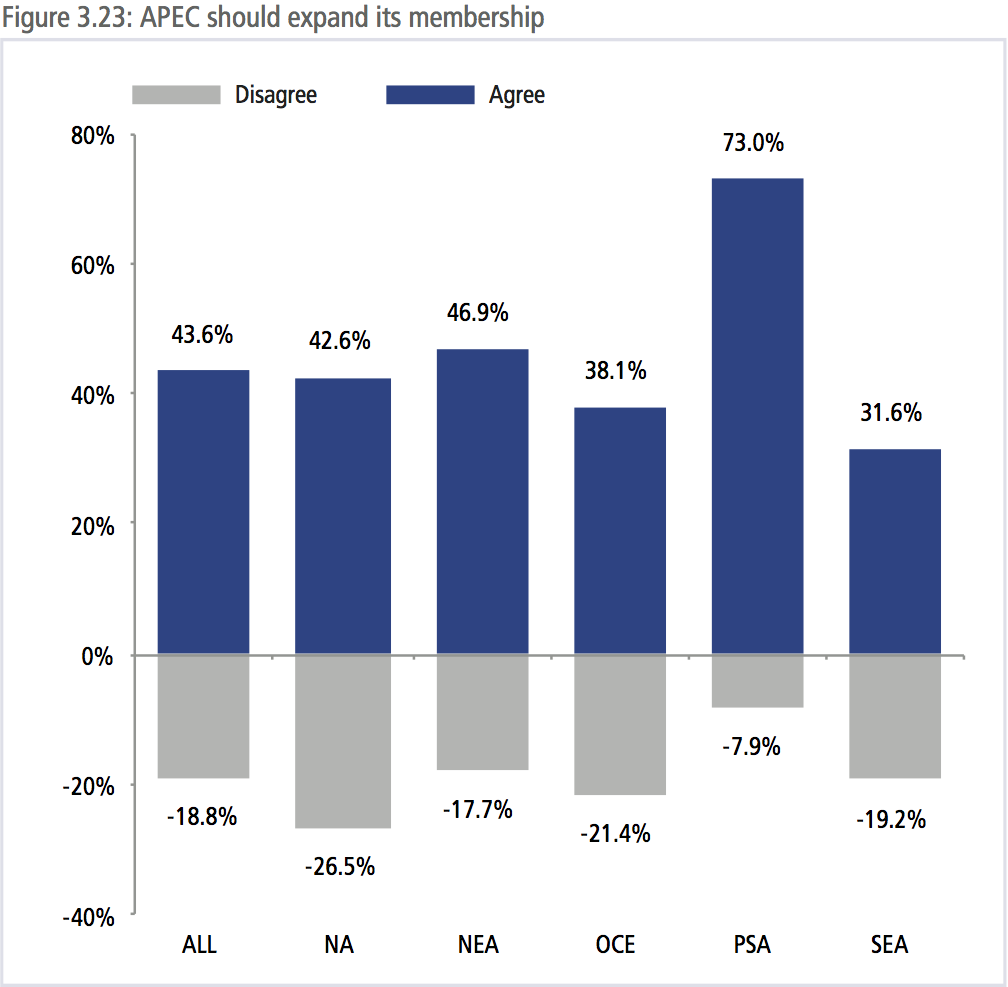
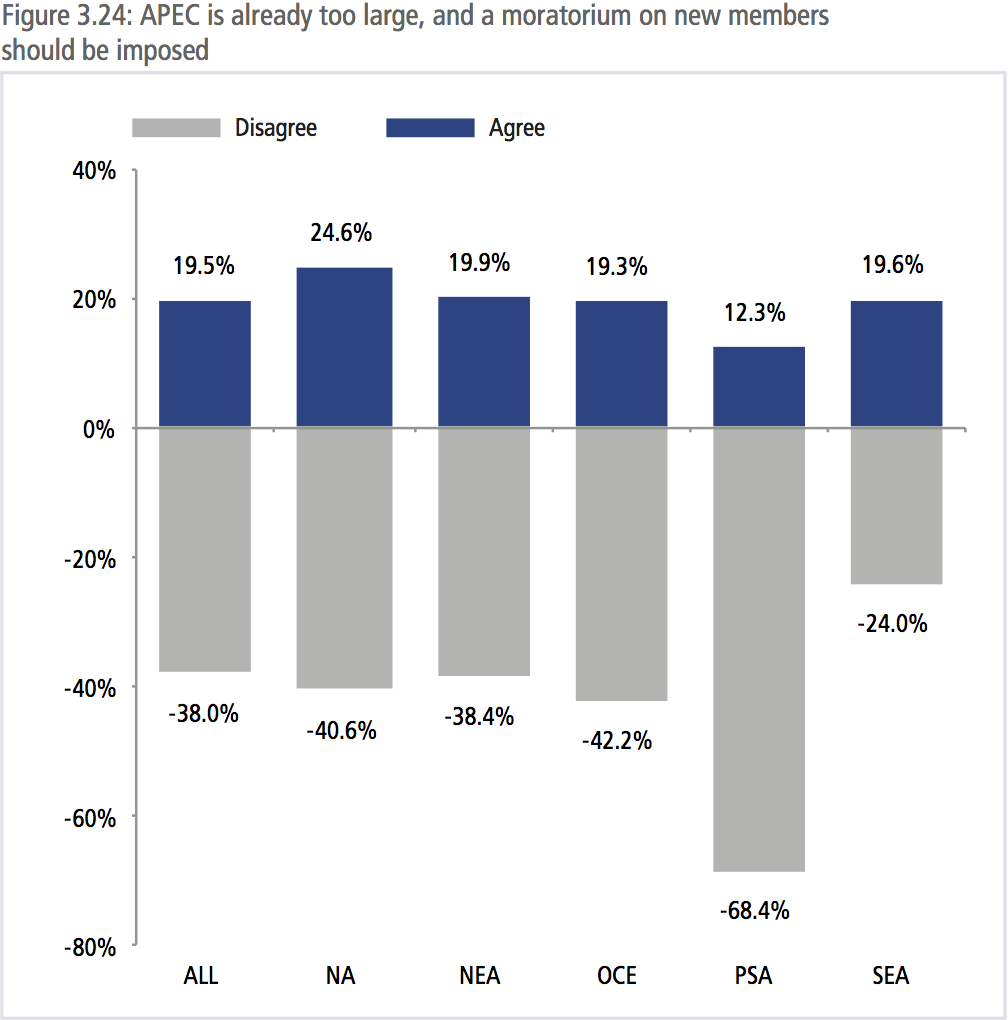
 While the overall view from the policy community is that it is time for APEC to expand its membership, the level of enthusiasm for the idea varies across the region. Respondents from Pacific South America are the most enthusiastic with 73 percent agreeing with the idea that APEC should expand its membership while only 32 percent of Southeast Asians agreed. To further clarify thinking, respondents were also asked if APEC’s membership was already too large and a moratorium on new members imposed. The responses were a virtual mirror of the first question on membership with 38 percent disagreeing and 20 percent disagreeing. Not surprisingly, those who disagreed the most that APEC was already too large were respondents from Pacific South America.
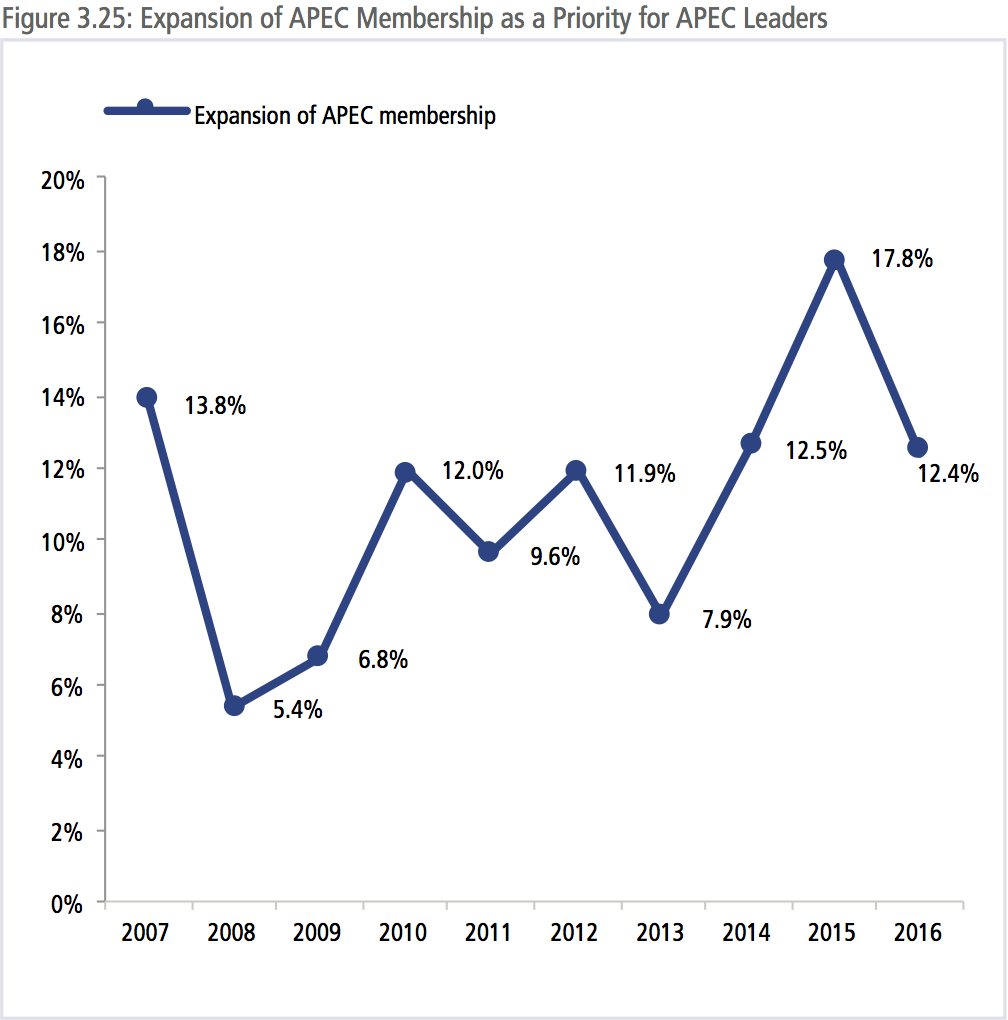
However, prospective members should not get their hopes up too high; as shown in Figure 3.25, only 12.4 percent of respondents selected APEC membership as a priority for APEC Leaders’ discussions, making it the 19th highest priority out of a list of 28. This is a decrease from last year’s survey which had APEC expansion as the 14th highest priority.
PRIORITIES FOR APEC LEADERS
The top 5 priorities for APEC Leaders’ discussion in Lima were:
- Progress towards the Bogor Goals and the Free Trade
 Area of the Asia-Pacific (FTAAP)
- The APEC Growth Strategy
- Structural reforms
- The emergence of anti-globalization & anti-trade sentiments
- Improvement in regional logistics & transport connectivity
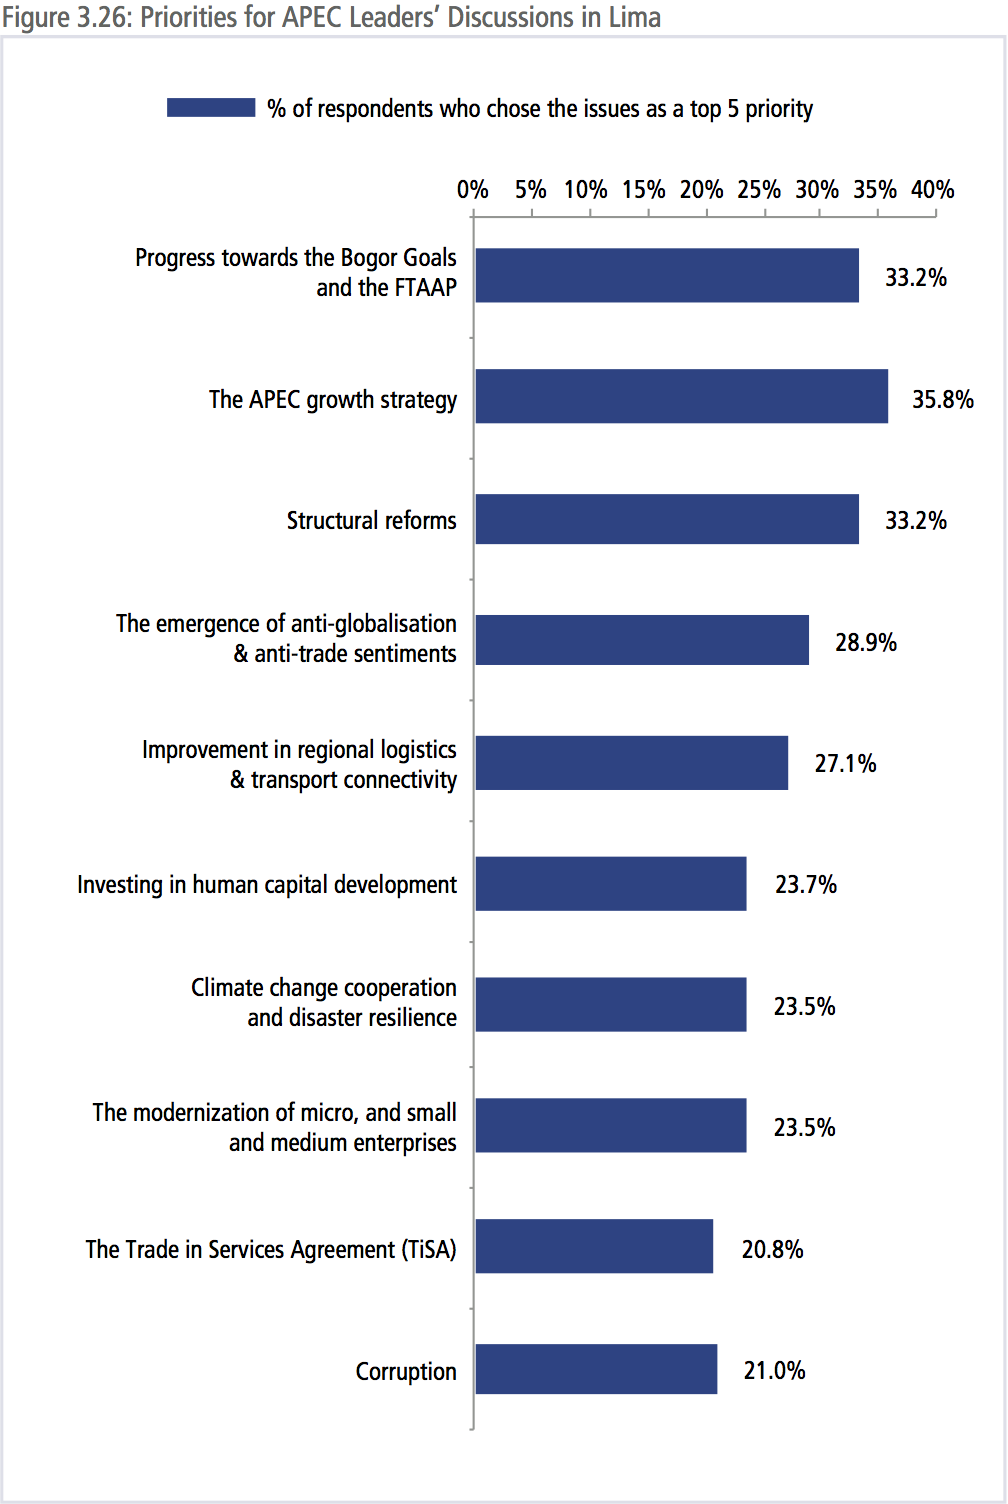
Figure 3.26 shows the top 10 priorities in order of their weighted scores but the figures shown are the percentage of respondents who selected the issue as a top 5 priority. The list includes all of the themes that APEC set at the beginning of 2016 except for fostering the regional food system. Only 8.5 percent of respondents selected this as a top priority for APEC Leaders’ discussions making it the 26th out of 28 issues. The challenge for all international organizations, especially those that have been in existence for a number of years, is that the list of issues they are expected to deal with becomes longer and longer each year, especially in a grouping as diverse as APEC.
The top priorities identified by the regional policy community is similar to that of last year. Indeed, the FTAAP has been the top priority for many years running, similarly the APEC growth strategy was also the second highest priority last year. However, perhaps reflecting the concerns over the failure to implement them, structural reforms were the third highest priority. In 2015, APEC adopted the Renewed APEC Agenda for Structural Reform (RAASR) in which APEC economies are expected to set out their own individual action plans for implementing reforms by 2020.
Another and perhaps more important priority is the emergence of anti-globalization and anti-trade sentiment. It was by far the highest priority selected by North Americans and Oceania, the 4th by Northeast Asians, 9th for Pacific South America and 10th for Southeast Asians. To put these into perspective, 56 percent of respondents from North America selected anti-globalization as a top priority compared to just 20 percent of Southeast Asians.
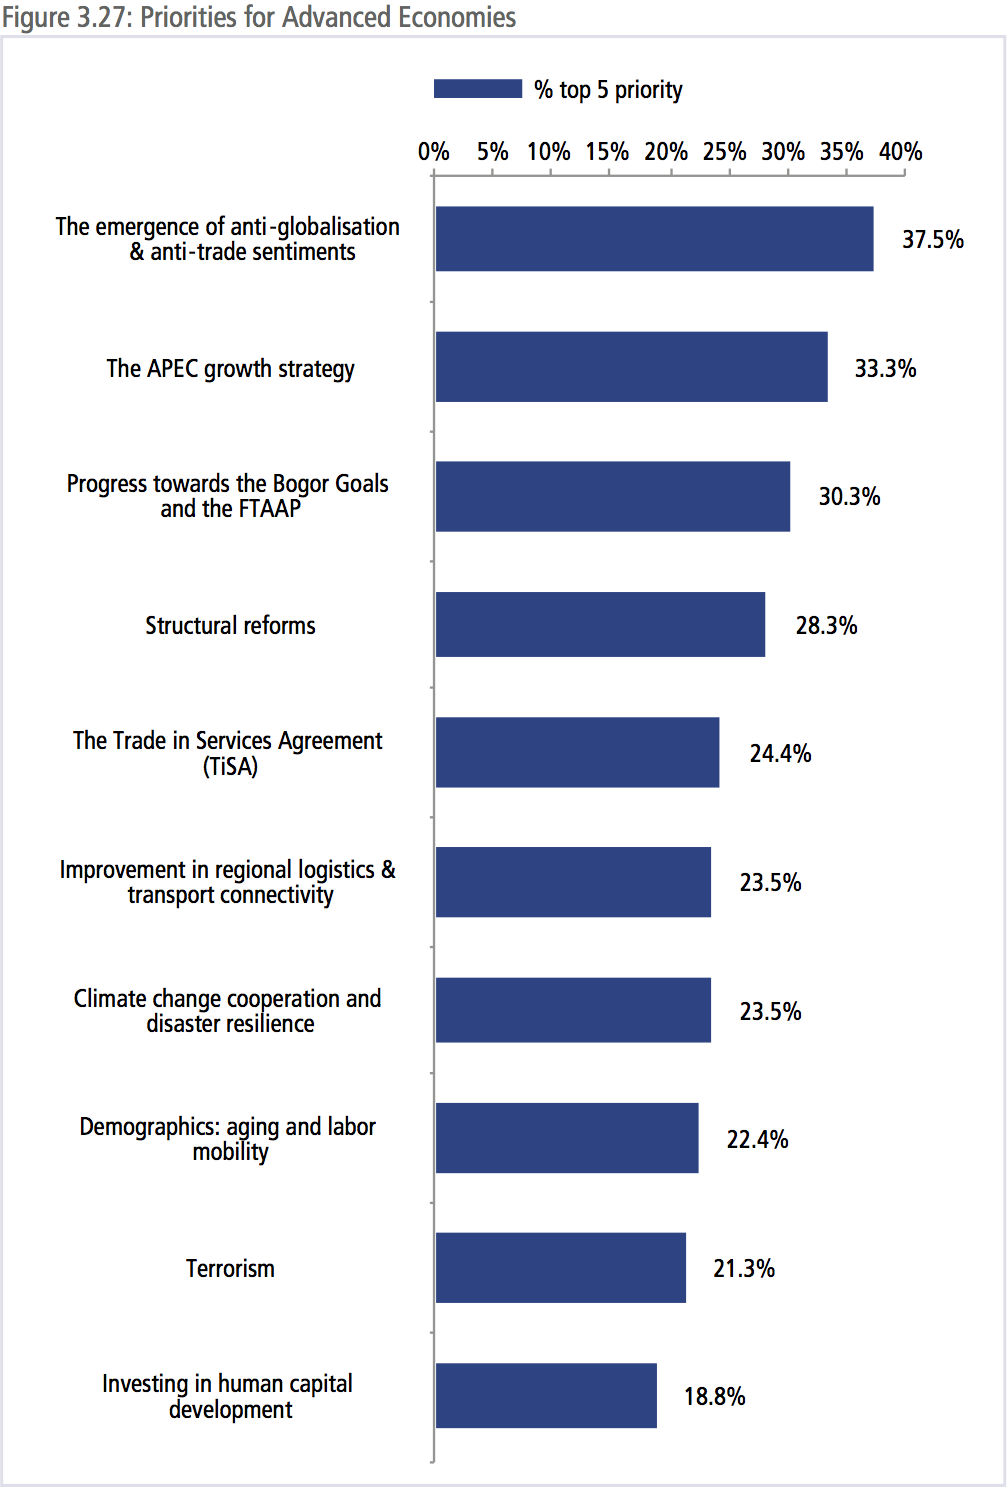
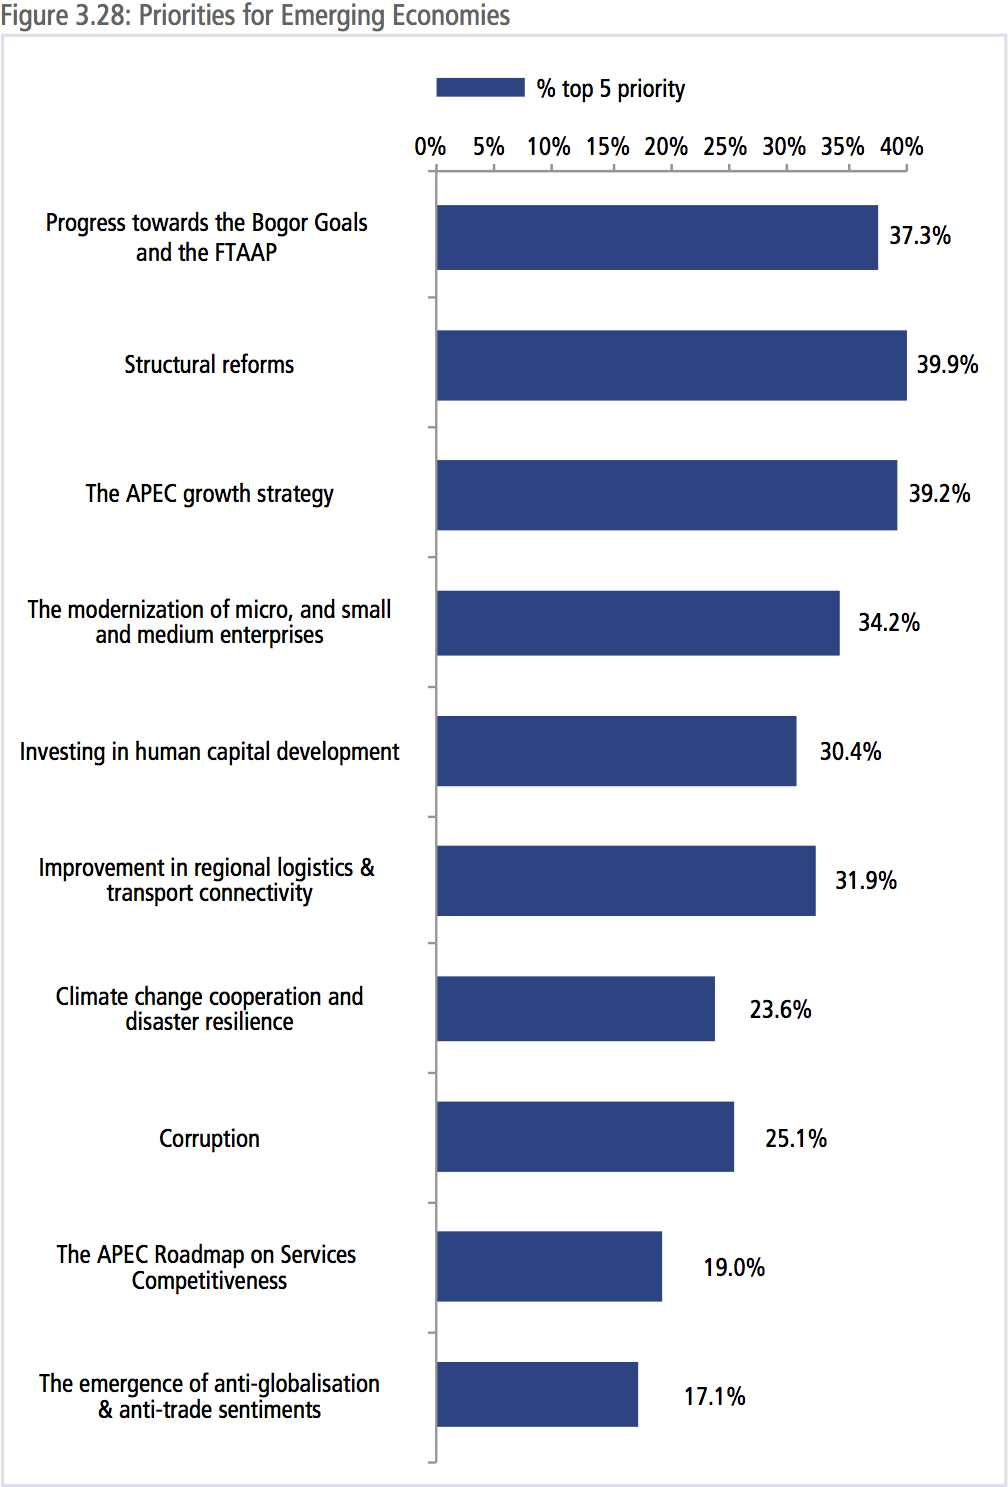
Figures 3.27 and 3.28 show priorities in order of importance for advanced and emerging economies respectively. The biggest difference was on the relative importance of discussing the rise in anti-globalization and anti-trade sentiments.
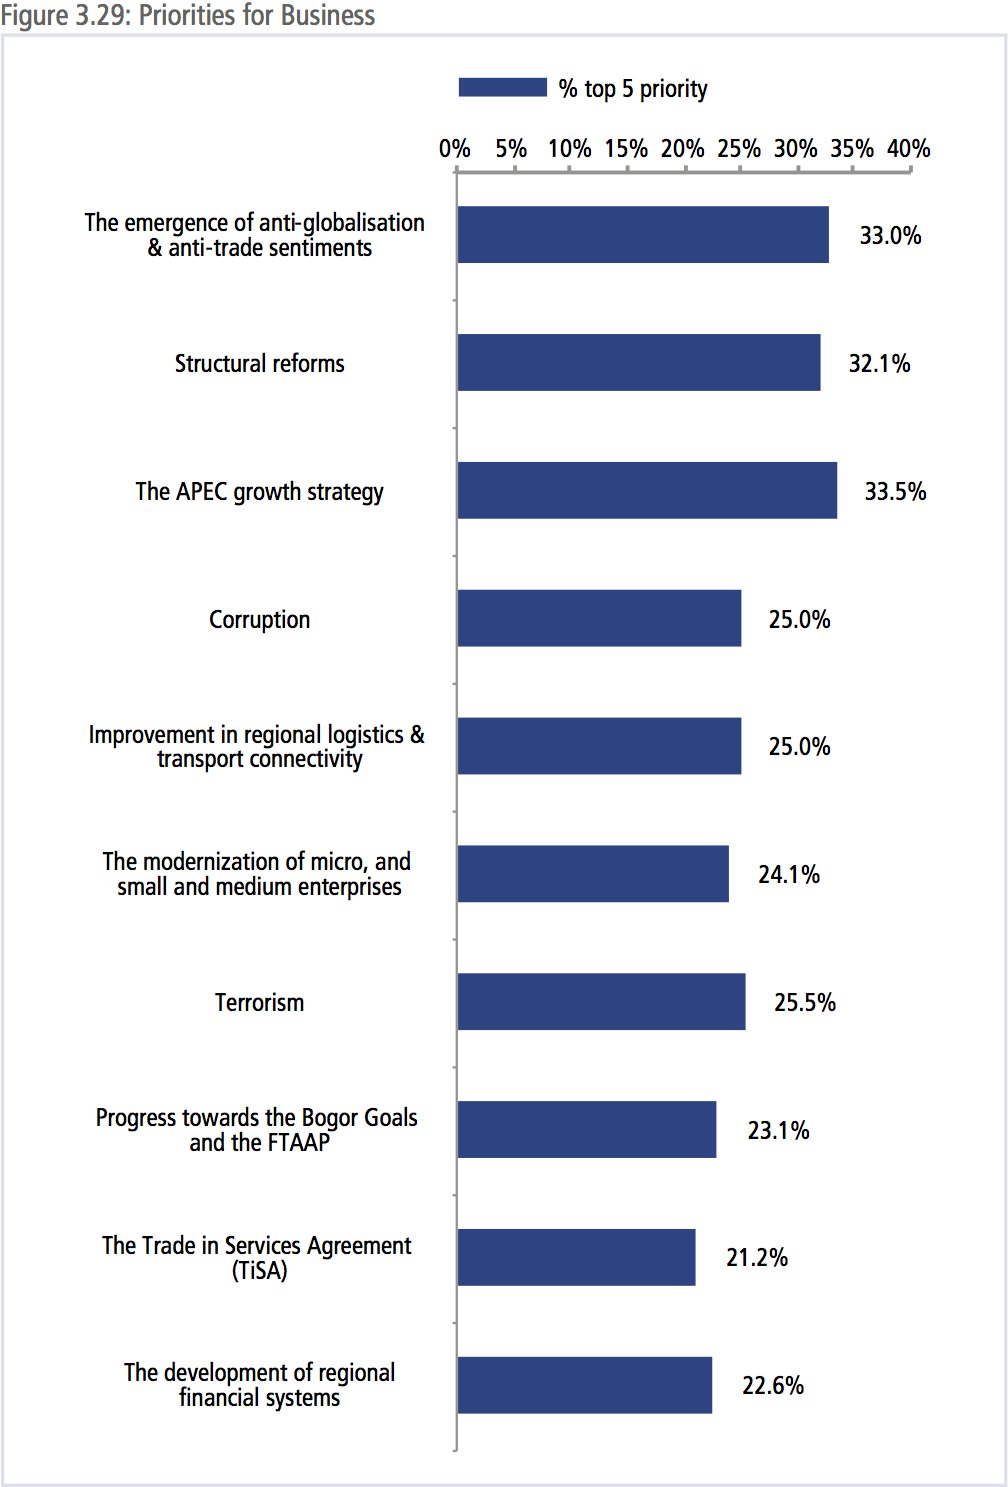
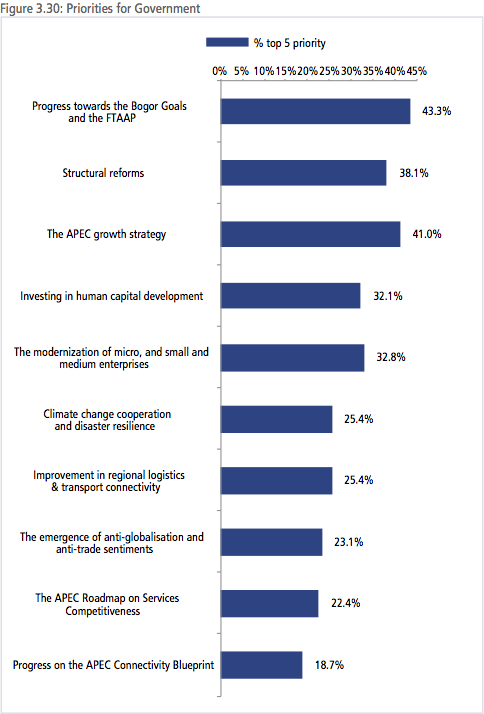
Even though the FTAAP was originally a proposal from the business community, this year, other concerns have topped their list of priorities, notably the emergence of anti-globalization sentiments. On the other hand, government respondents placed a much higher priority on the progress towards the Bogor Goals and the FTAAP. There was slightly less alignment between business and government views on priorities than there was among advanced and emerging economies views. For businesses only: Corruption; Terrorism; Development of regional financial systems; and Trade in Services Agreement (TiSA). For government only: Climate change cooperation and disaster resilience; Investing in human capital development; Progress on the APEC Connectivity Blueprint; The APEC Roadmap on Services Competitiveness.
In spite of the very large differences among Asia-Pacific economies in terms of size, population and level of development, since the formation of APEC in 1989 and even before that, there had been a broad consensus that the best route for regional economies to develop was through free and open economies. It would be easy to understate the difficulties many economies faced in adopting this stance – especially emerging economies. However, through the Bogor Goals the region adopted a set of principles through which regional leaders had the confidence that their most important trading partners would be following the same path. As indicated in this year’s survey findings, there is a risk that the consensus around these principles is faltering – especially in advanced economies. APEC leaders, ministers and officials need to work together to rebuild that consensus or risk the gains of the past few decades being lost.