Chapter 1 - Asia-Pacific Economic Outlook

Just three years after the “Great Recession”, the world economy is facing the threat of a stalled recovery or worse, a double-dip economic downturn.
The skittish outlook is due to prolonged and possibly worsening economic weakness in the traditional engines of growth -- the United States and the EU -- and is compounded by the reality that emerging markets are not yet able to provide a sustained source of global demand to replace the US and the EU, notwithstanding the important reflationary role that they played (China in particular) during the 2008-2009 downturn. Even before the deal to raise the debt ceiling was reached, recovery in the US was sputtering. The fiscal drag from any likely package of deficit reduction in the US in the foreseeable future will only add to near-term economic weakness, if not outright recession. The Euro zone in turn is constrained not only by sharp fiscal tightening but also from a sovereign debt crisis that could spill over into a broader financial sector meltdown.
On Shaky Ground
The economies of the Asia-Pacific region grew by 4.8 percent in 2010, higher than had been forecast in the IMF’s October 2010 update to the World Economic Outlook, and matching the rate the region grew at in 2006 and 2007. However, the June 2011 IMF update revised downwards the 2011 forecasts for Japan and the United States, resulting in a slower real GDP growth forecast for the region as a whole at 3.6 percent in 2011. It is likely that there will be further downward revisions to the growth outlook for the US and other Asia-Pacific economies, which will effectively mean a substantial slowing compared to 2010, barely two years into a “recovery”.
Emerging Markets Driving Growth 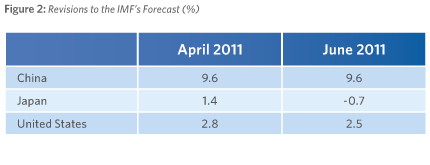
A multi-speed recovery has continued to characterize the growth picture in 2011 and likely into 2012 with emerging market economies doing considerably better than developed economies. The weighted average real GDP growth for developed market economies this year is expected to be 1.8 percent, rising to 2.8 percent in 2012. Emerging market economies in the region are 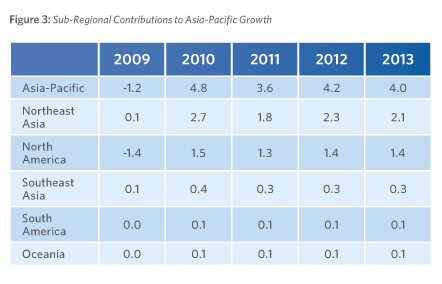 expected to grow by 7.1 percent in 2011, moderating slightly to 6.9 percent next year.
Asia-Pacific Economies
The combined economic output of the Asia-Pacific region in 2010 was US$35 trillion or a little over half of the world’s total. Japan and the United States account for over 55 percent of the regional total so it comes as little surprise that the downgrade in forecast for these two economies results in lower growth estimates for the Asia-Pacific as a whole.
The Asia-Pacific region is itself characterized by multi-speed growth, as can be seen in the performance of various sub-regions. Of the 3.6 percent real GDP growth that the region is expected to experience in 2011, 1.8 percentage points are projected to come from Northeast Asia and 0.3 points from Southeast Asia. Over the past decade, emerging market economies have contributed well over 50 percent to the region’s growth.
 Rising Concerns over Inflation
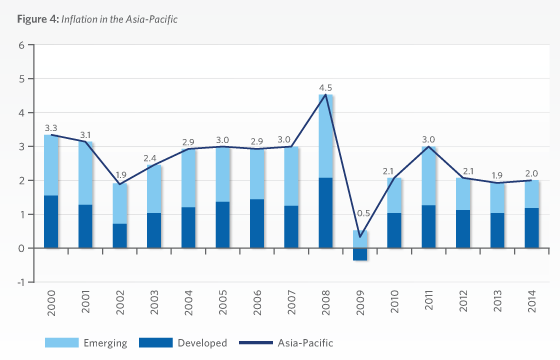
Inflation in the region for 2011 is expected to be close to 3.0 percent, moderating to 2.1 percent in 2012. However, as with the GDP growth, the aggregate inflation number masks large differences between developed and developing economies. The developed economies of the Asia-Pacific region are experiencing price increases around 1.8 percent per annum whereas inflation in emerging economies is over 5.0 percent.
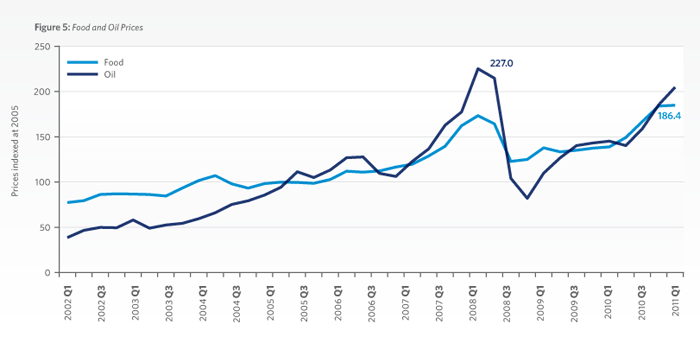
A major concern during the first half of 2011 was the sharp rebound in energy prices to levels not seen since the first half of 2008. While the rising price of oil can be attributed to extraordinary events that took place in major oil exporting regions in early 2011 and have since moderated, food prices remain high due to longer adjustment periods in supply and demand.
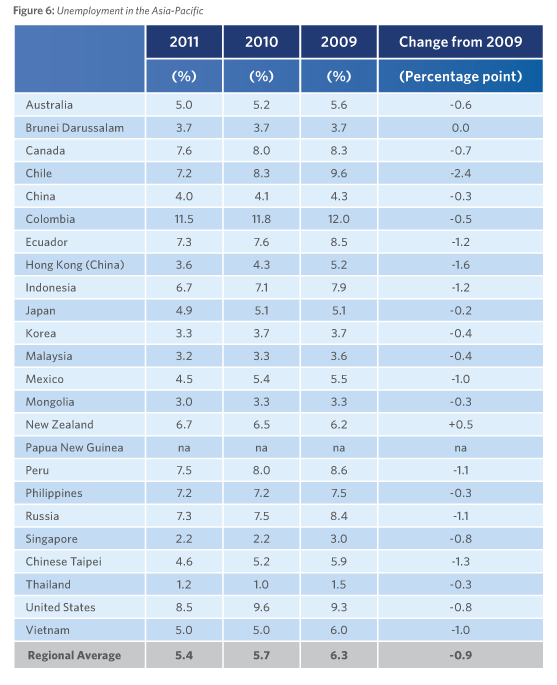
Unemployment
Even though growth has returned to the region, there is concern in some economies about a jobless recovery. At the height of the crisis in 2009, the average unemployment rate in the region was 6.3 percent. While the unemployment rate is expected to fall to 5.4 percent this year and to 5.3 percent in 2012, these levels are still higher than the 5.1 percent rate before the downturn. Unemployment not only remains stubbornly high in the United States, but is showing signs of worsening in the second half of 2011.
Current Account Imbalances
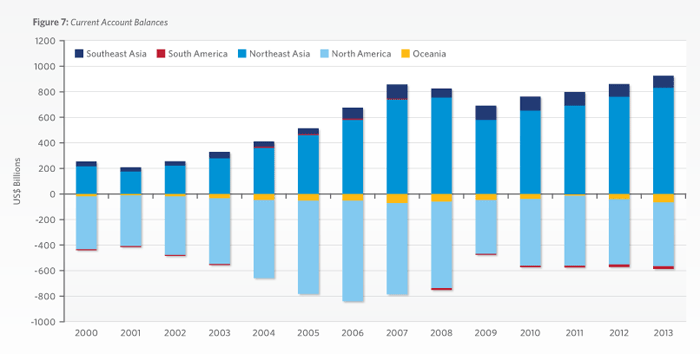
One of the positive outcomes of the recent economic downturn has been a correction of current account imbalances in the region. As shown in Figure 7, the North American current account deficit peaked in 2006, and declined sharply in 2007-2009. Further improvement appears to have stalled, however, and there is a prospect of a modestly widening North American current account deficit in the years ahead. At the same time, the current account surpluses of Southeast and Northeast Asia appear to again be on a rising trajectory. These imbalances may not be an economic problem as such, since they represent a stable or falling share of GDP, but widening deficit numbers could become political fodder particularly in the US and lead to trade tensions, especially in a presidential election year.
Exchange Rates
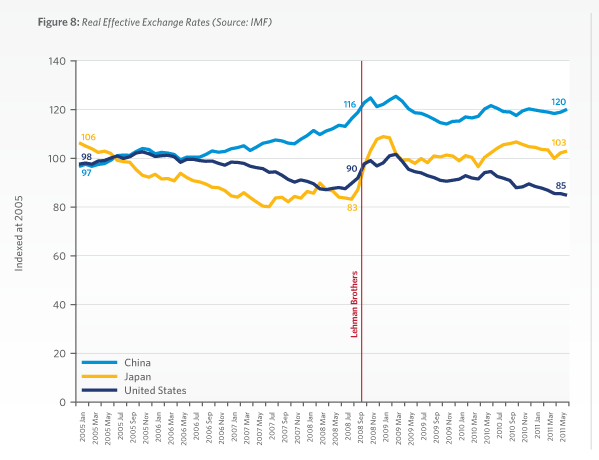
Since the beginning of the crisis the real effective exchange rates of the three largest economies of the Asia-Pacific have shown signs of adjustments. The US dollar’s real effective exchange rate, for example, has depreciated by about 7 percent since the Lehman Brothers bankruptcy in September 2008 while the Japanese Yen has appreciated by 18 percent over the same period. The Chinese Yuan has only appreciated by 1 percent. Taking a longer time frame, however, the change in relative prices is greater: using 2005 as the base year and comparing it with June 2011, the IMF’s REER shows that the Yuan has appreciated by 20 percent, the Yen by 3 percent, and the US dollar has depreciated by 15 percent over the period.
A Sustainable Recovery?
In 2009, a PECC task force on the global economic crisis looked at the expenditure patterns before the crisis and recommended adjustments that needed to take place for sustainable growth in the postcrisis period. To assess the implications of rebalancing, the task force used a simple simulation to calculate a pattern of expenditures in 2007 that would have brought US deficits down to sustainable levels. For example, compared to their levels in 2007 (the last ‘normal’ year before the crisis), investment in Southeast Asia would need to increase by 5 percent, consumption in the United States would need to decrease by 2 percent, and consumption in China would need to increase by about 5 percent. For the external sector, the United States would need to increase its exports by 9 percent, while China and Japan would need to decrease their exports by about 4 percent compared to their levels in 2007.
The good news is that there are signs that rebalancing is beginning to take place but it is still too early to make a judgment on whether or not these structural changes are simply a result of the extraordinary economic conditions prevailing in the region. These adjustments are most obvious in the external balances (net exports). In 2007, China’s net exports accounted for 9 percent of total GDP; by 2010, this had fallen to 4 percent. Likewise, the US’ net exports were a negative 5 percent of GDP; by 2010, this had fallen to a negative 4 percent (see Annex A Table 5 for details).
However, while the news is positive on external demand, internal structural imbalances are still evident with high private consumption in deficit economies and low private consumption in surplus economies.
In China, the share of private consumption in GDP has fallen from 54 percent of GDP in 1990 to 36 percent in 2008 or by 0.96 percentage points over the past two decades. While the decline has moderated to 0.4 percentage point decline between 2008 and 2009, the persistence of a downward trend is not encouraging. Likewise, the United States is struggling to overcome its own structural imbalance, with consumption as a percentage of GDP remaining stubbornly high at 71 percent.
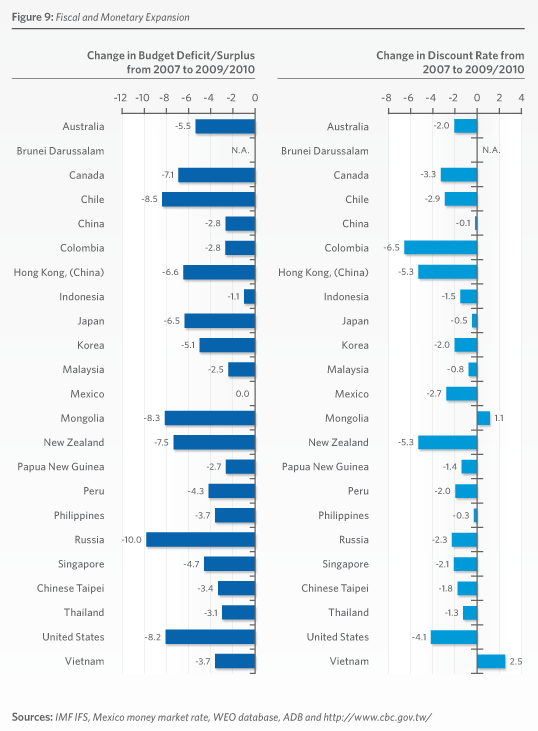
Less Room to Maneuver
In response to the financial crisis that began in 2008, the economies of the region and the world adopted unprecedented coordinated stimulus policies to mitigate the impacts of the crisis. Economies of the Asia-Pacific region adopted stimulus packages of about US$1.7 trillion.
As a result of the fiscal stimulus during 2007-2010, public deficits have increased as a percentage of GDP in the region over the past three years. Although some economies have more room to maneuver than others in the case of another downturn, there is a need to impose fiscal discipline at some point in the near future. Likewise, interest rates have been lowered to near zero in a number of Asia-Pacific economies.
Changing Asia-Pacific Trade Patterns
Rebalancing of demand in the Asia-Pacific region has had a modest impact on trade flows. North America has become a less important destination for Asian exports, but this trend predates the 2008 recession. In some sectors, as described below, there was relatively little transpacific trade to start with, despite very large numbers for the region as a whole. The following section provides a glimpse into the sub-regional dimensions of Asia-Pacific trade and they highlight the dominance of intra-regional trade in some of the most-traded product categories.
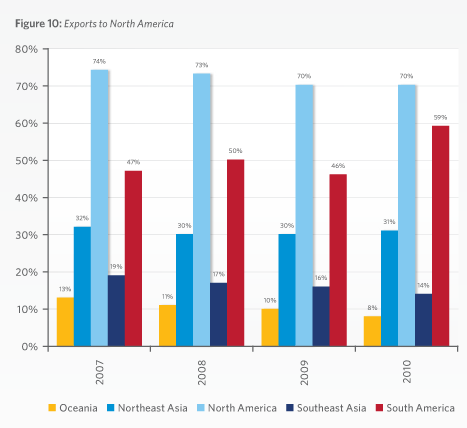
Exports to North America Slowing
Prior to the crisis, North America absorbed 44 percent of regional exports. During the 2008-2009 period, this dropped to 42 and 40 percent respectively. However, the picture is much more mixed when looking at sub-regional trade to North America.
Intra-North American exports still account for 70 percent of the sub-region’s exports to the Asia-Pacific region, while South American exports to North America are also high at 59 percent.
However, transpacific trade flows tell a different picture. North America’s share of Southeast Asia’s exports to the region has been declining since 2007, from 19 percent in that year to 14 percent in 2010. The share of Northeast Asia’s exports to North America compared to exports to the Asia-Pacific region as a whole has remained steady at roughly 30 percent.
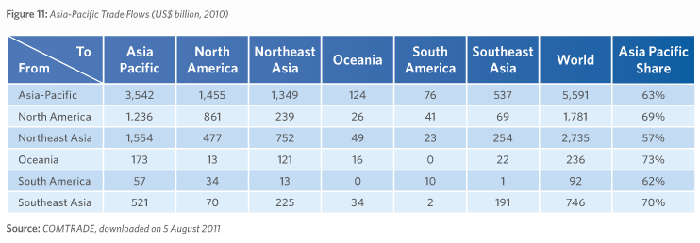
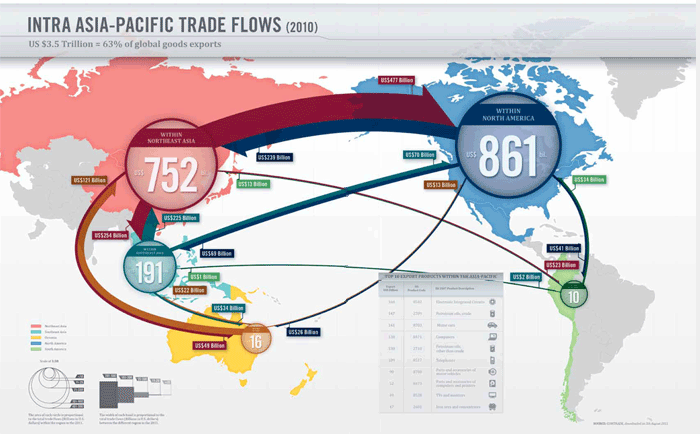
In 2010 intra-regional exports were worth US$3.5 trillion or 63 percent of the region’s total exports. However, this trade is dominated by a number of sub-regional relationships. Exports among Canada, Mexico and the United States (North America) account for 24 percent of total intra-Asia-Pacific exports, while exports among Northeast Asian economies account for another 21 percent of regional trade.
The top products exported in the Asia-Pacific region in 2010 were: electronic integrated circuits; petroleum oils derived from crude; cars; automatic data processing machines; petroleum oils derived from non-crude sources; telephones; car parts; computer parts; and monitors. As with overall flows, the trade pattern of many of these items is dominated by sub-regional flows rather than by trade more broadly across the Asia-Pacific region.
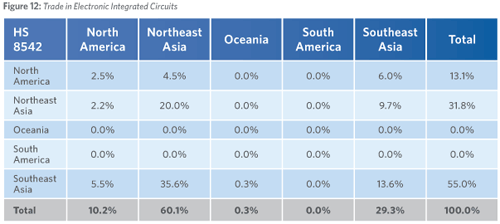 Exports of Electronic Circuits: Dominated by Intra-Asian Flows
Electronic circuits were the top exported good within the Asia-Pacific region in 2010 totaling US$160 billion. However, much of these flows were exports either within East Asia (Northeast and Southeast Asia combined) reflecting regional supply chains. The transpacific trade in electronic circuits (from East Asia across the Pacific) was just 8 percent of this trade.
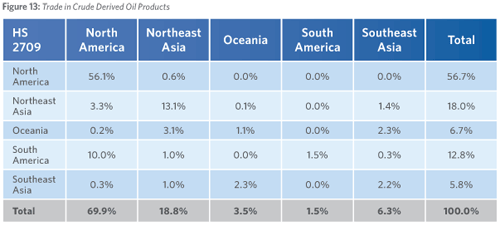
Exports of Petroleum: Dominated by Intra-American Flows
Exports of petroleum oils and oils obtained from crude were the second highest exported product within the region in 2010 totalling US$147 billion. As with trade in electronic circuits, this trade is dominated by sub-regional trading flows. Intra-North American trade accounted for 56 percent of the total exports of these products within the region, with anothe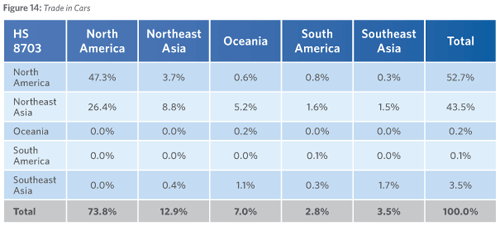 r 10 percent coming from South America to North America.
Exports of Cars: Dominated by North American Trade
The third most trade product within the region was cars. Exports of cars within the region totalled US$141 billion in 2010, while 47 percent of this was trade within North America, 26 percent were flows from Northeast Asia to North America and another 9 percent within Northeast Asia.
Prospects for the Development of Transpacific Energy Trade
Even though oil and gas is the most traded product in the Asia-Pacific region, there is virtually no energy trade across the Pacific. The major energy importing economies of Northeast Asia source their oil and gas largely from the Middle East, Southeast Asia and Australia, while the United States imports energy from the Americas, West Africa, and the Middle East. Indeed, transpacific trade in energy products (oil, gas, and coal) accounts for only 1.4 percent of global trade in those products. The segmentation of energy markets between Asia and the Americas is seen in the sharp price differential for natural gas between the two regions, and – more recently – in a price differential for crude oil as well.
A number of developments in recent years have raised the possibility of transpacific trade in oil and gas, and the emergence of a more integrated and competitive market in energy products in the Asia-Pacific region. These include:
- a) The discovery of massive unconventional (shale) gas deposits in the United States and Canada which are creating a gas glut in North America;
- b) Increased demand in Asian countries for less carbon-intensive energy sources, in particular a shift away from coal to natural gas;
- c) Concerns about nuclear power following the Fukushima Daiichi disaster and the resulting search for clean alternatives to nuclear energy;
- d) The changing energy balance in Southeast Asia, particularly Indonesia and Malaysia, which will soon be importers of natural gas
- e) Rapidly growing investment by Asian national oil and gas companies in North American energy assets, especially in the Canadian oil sands, which has the third largest proven reserves of crude oil in the world.
Even taking into account the higher cost of shale gas production, the substantial investments required to build pipelines and liquefaction plants, and the transportation cost of shipping LNG across the Pacific, North American gas could be competitive in Asia against existing suppliers, or at the very least serve as an secondary source of supply for Northeast Asian economies looking to diversify their energy imports or seeking more secure sources. Likewise, the prospect of North American crude oil exports to Asia is increasingly attractive given the gas glut in the United States and a widening price differential between benchmark West Texas Intermediate and Brent crude oil prices.
Favorable economics, however, do not guarantee that transpacific energy trade will become a reality, since there are political, regulatory, and environmental risks to be overcome, as well as a need for substantial capital investment. Nevertheless, the prospect of transpacific energy trade would be good news for Asia-Pacific regional integration, since it would lead to a more competitive energy market and more transparent pricing of energy products, likely resulting in a reduction in price differentials between Asia and North America. In addition, transpacific energy trade would allow both exporters and importers in the region to diversify their markets, and hence support energy security objectives.
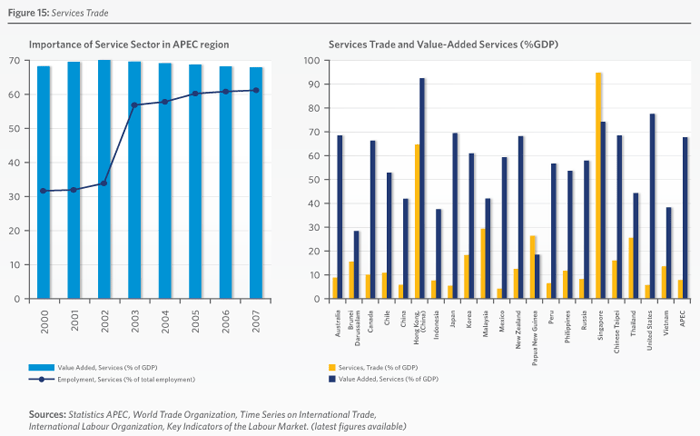
Trade in Services
Services are an increasingly important part of the region’s economies. For the APEC region as a whole, the service sector accounts for 61 percent of jobs and 68 percent of value add. What has been most impressive is that the services sector’s share of employment has almost doubled over the past 10 years. While services account for over 50 percent of value-add in most APEC economies, services trade as a percentage of GDP is much lower with a much greater range of importance from as low as 5 percent to as high as 90 percent. This indicates a large amount of room for services trade to grow within the region.
Trade in services is an issue PECC has been looking at over the past year. Services exports for Asia- Pacific economies have grown by over 135 percent over the past decade. While the growth of services exports has been impressive, the Asia-Pacific region’s share of global services exports has been declining over the same period from 42 percent to around 40 percent.
Global trade in services naturally experienced some decline in 2009 but much less so than the decline in trade in goods that year. Importantly, the APEC region experienced even less of a decline in 2009 than the global average, the outcome being that APEC economies gained in percentage share of global services exports, a trend that continued, indeed intensified, into 2010. By 2010, the APEC region accounted for 40% of global services exports.
However, there is very little disaggregation in the official data; even the best national collections available cover at most 70 categories of services, as distinct from 7000 categories of goods. There is very limited data on the direction of services trade and where it exists it is for very aggregated groups of activities. There is no published official data on mode of international services supply. This makes it difficult for policy-makers to react to changes taking place in the business community.
It is important to recognize, in addition, that the services sector makes a much larger contribution to exports than its direct share because services are often integrated or bundled with goods. Some studies indicate that services account for 25 percent of the export value of some commodities, likely higher for manufactured goods.
An APEC Policy Support Unit (PSU) study suggests that this low level of services trade has much to do with policy-related barriers to trade. Despite the fact that services is the sector with the highest degree of government intervention, and where the pay-off from trade and investment reform has been shown to be greatest, relatively little binding progress has been made in inter-governmental negotiation on services at either the global or regional level. The longer stalemate persists in the Doha Development Agenda, the more momentum appears to be building in the regional business community for a reinvigorated, stand-alone approach to services trade negotiations, if necessary on a critical mass plurilateral basis.
<< Previous
Next >>